

US Growth and Macro Outlook

Introduction
The United States has remained robust throughout the interest rate hiking cycle. Many people believed that the United States was headed for a hard landing, but this never materialized, with high real GDP (RGDP) and nominal GDP (NGDP). The United States surprised many, as equity markets moved higher and interest rates did not slow growth. As we enter 2025, the question remains whether this growth can be sustained. This will be discussed in this post.
Growth (GDP)
U.S. GDP has been robust, with both real GDP (RGDP) and nominal GDP (NGDP) showing strong performance. Currently, RGDP is at 2.7%, and NGDP is around 5%. The overall backdrop of U.S. growth has been a huge surprise to many. Going into 2025, I expect growth to cool somewhat but still remain higher than the average we have seen over the past few years. While RGDP may not be significantly higher, it will still show some improvement, likely around 30-50 basis points above the roughly 2% average growth we've experienced.

What has kept real GDP (RGDP) so elevated is continued strong consumer demand. The current levels of demand have allowed the U.S. to maintain rapid growth in RGDP, and I do not see this fading anytime soon. One of the largest drivers of consumption is productivity and wages. As productivity or efficiency increases, so do wages (ceteris paribus). The current levels of wage increases in the United States should continue to boost consumption. Labor income remains the most important variable for sustained growth in consumption.
Moving on, business investment remains robust. We have continued to see significant factory construction, most of which is driven by the technology industry, particularly in sectors such as computers, electronics, semiconductors, and electric vehicles. Firms have seen high returns on invested capital, which supports the idea that investment should continue to produce returns. As long as that remains true, we should continue to see increased business investment.

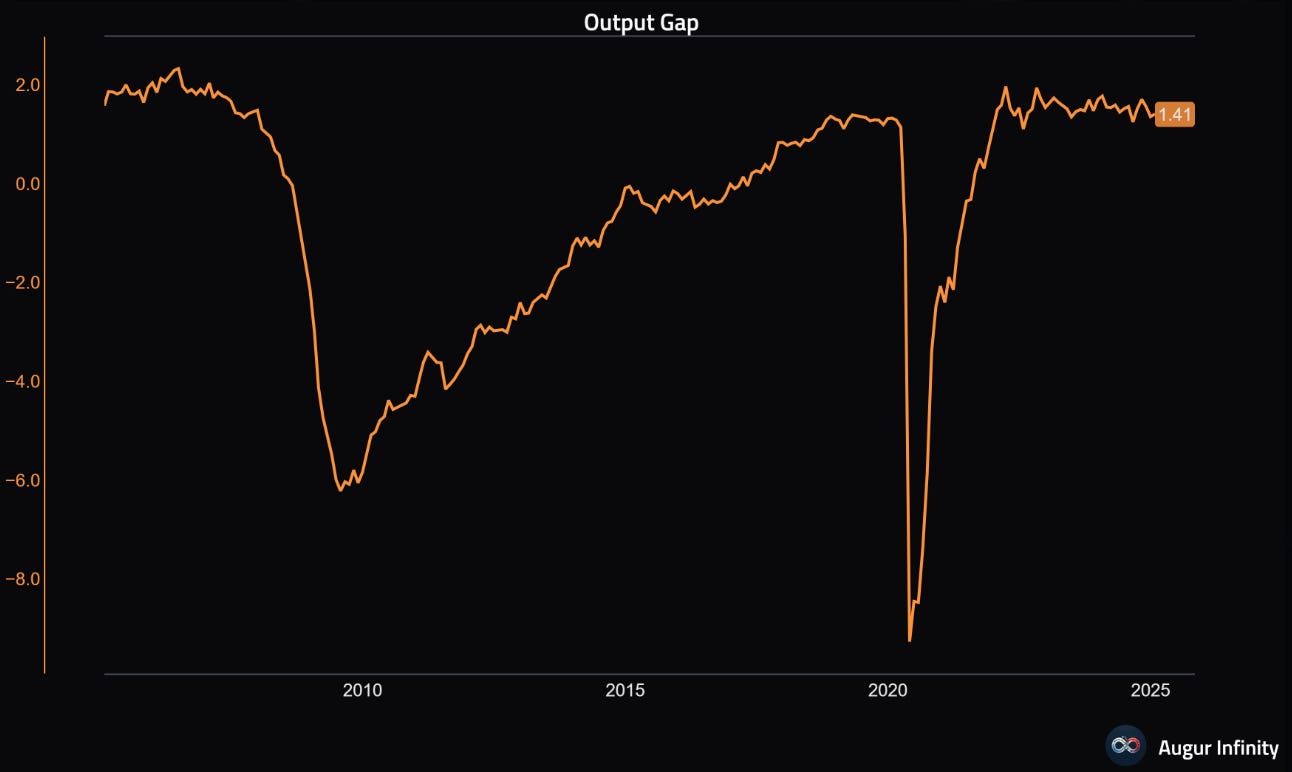
Given everything highlighted above, I do see some slowing into 2025, but nothing major, and I expect demand to continue to play a large role in the growth of the United States. One way we can analyze this is by looking at the output gap, which is calculated as (Real GDP - Potential GDP) / Real GDP.
The output gap measures the difference between the economy's actual output (real GDP) and its potential output (potential GDP). A positive output gap indicates that demand exceeds supply, meaning the economy is operating above its capacity. This can be inflationary, but there are situations in which the economy’s capacity has shifted due to factors such as investment exceeding depreciation of capital, technological advancements, and other factors that allow the economy to reach a new steady state of potential output.
This appears to be the situation the United States is in, and it should continue to bode well for the U.S. to maintain its growth path into 2025.
Changing Tide
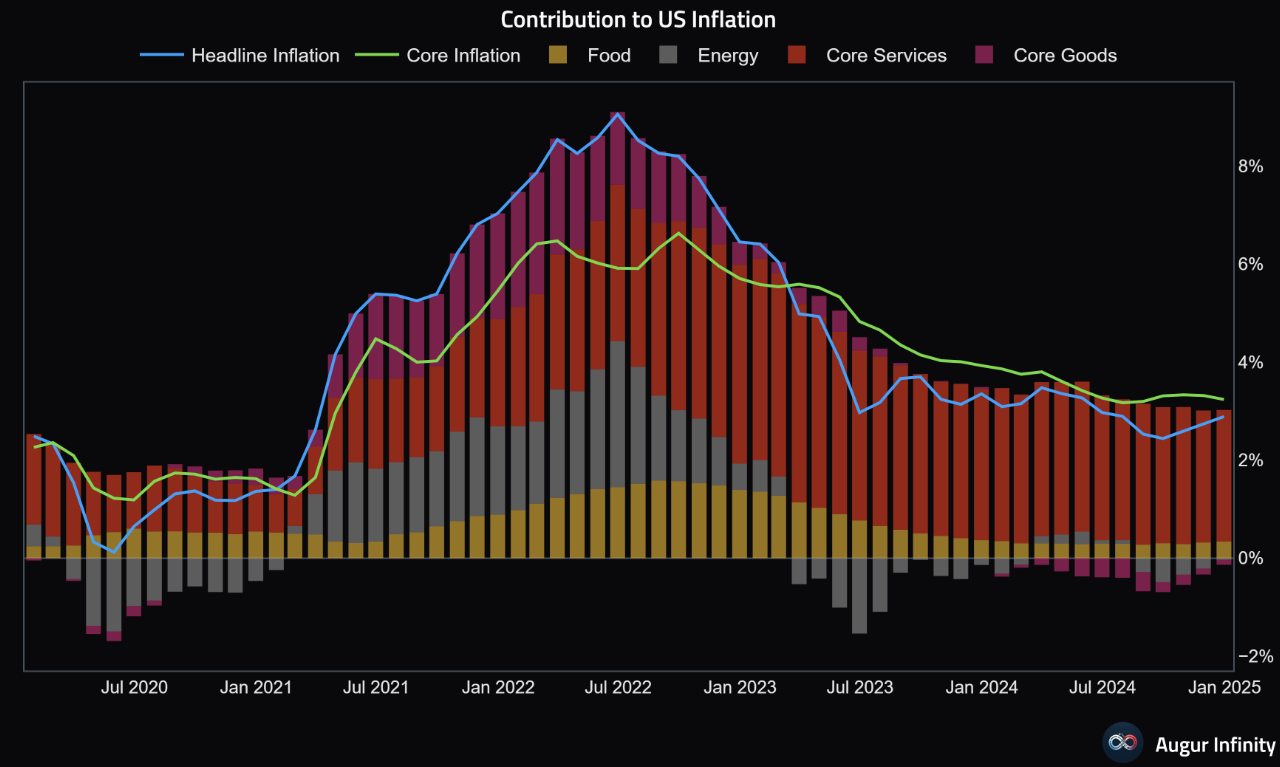
During the pandemic, we experienced more rapid demand growth and less supply, which pushed up the aggregate price level.
Looking ahead to 2025, the theme should be slower demand and more supply, easing the output gap and lowering the price level.
The return of an elastic aggregate supply curve, along with the AI and productivity boom, should lead to lower inflation and relatively moderate output growth, with a slightly positive output gap.
This contrasts with the COVID period, where we had a relatively inelastic aggregate supply curve, which drove both inflation and growth.


Rates
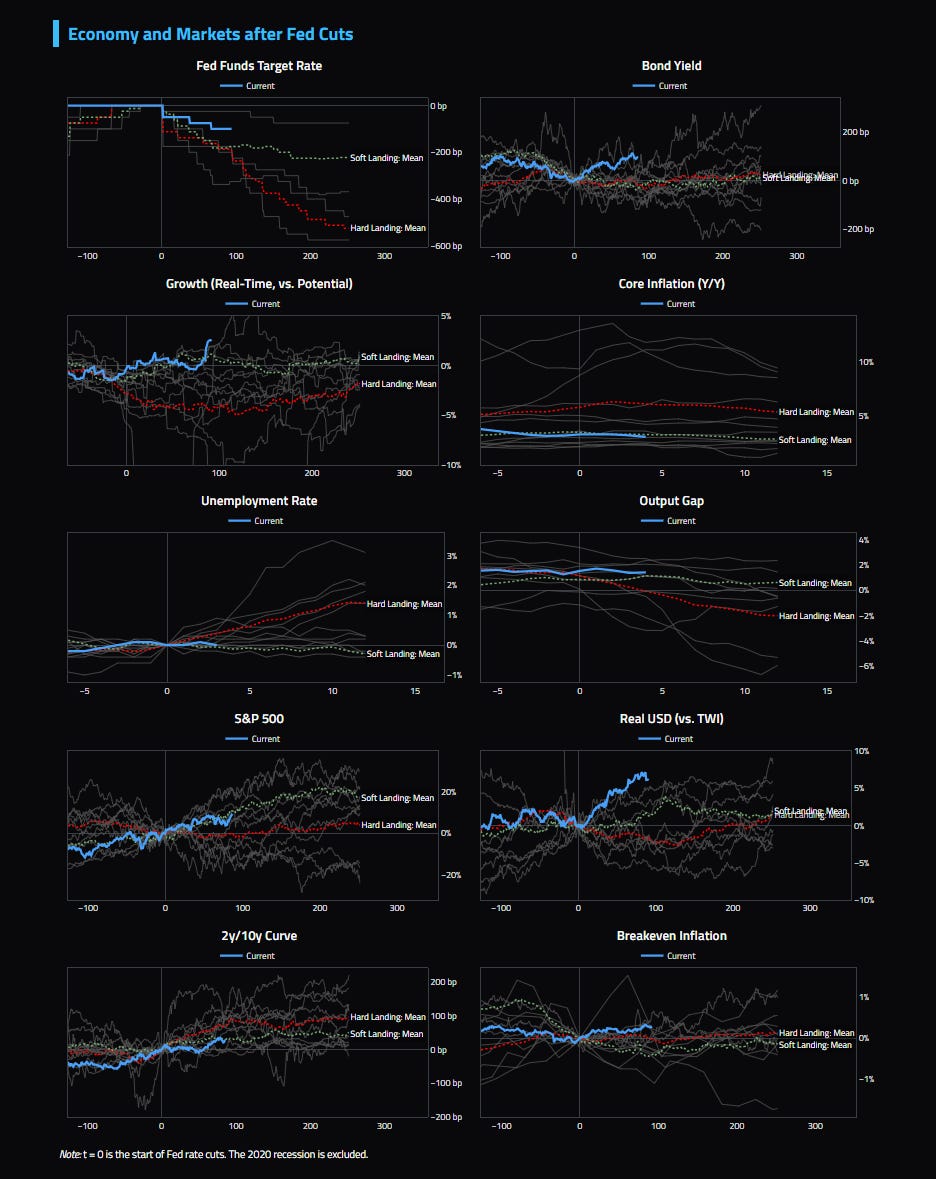
The market has continuously misjudged the path of rate cuts and hikes. Currently, for 2025, the market is expecting two rate cuts, totaling 50bps. With political pressure calling for lower rates and data easing slightly, I believe more cuts should be priced into 2025 compared to what we're seeing from OIS and Fed Funds Futures pricing. I think the dot plots might be off slightly, and we could see rates below 4% by the end of 2025.

The 5y5y is well above the midpoint of the dot plot. Historically, 5y5y has been relatively anchored until 2022, when growth, inflation, and what can only be described as a new paradigm took hold. It seems that expectations for the new normal for the Fed are too low, and markets anticipate a much higher neutral rate. The unanchoring of the 5y5y relative to the dots, along with economic resilience, continues to be the main focus. This also highlights the idea that the hard landing narrative has died.

As we look toward 2025, market expectations around Federal Reserve rate cuts are an interesting topic of discussion. Currently, implied probabilities from Fed Funds Futures suggest a relatively modest outlook for rate cuts throughout the year. Specifically, the market is pricing in around 50bps of cumulative cuts. This implies a fairly conservative view of the Fed’s actions, with relatively low probabilities of significant cuts in the near term.
However, I believe this is likely a fade, meaning that the market’s current expectations could be too restrained. Over time, as we move further into the year, I expect more cuts to be priced in. Economic conditions, political pressure, and easing data could all play a role in shifting these expectations.
Historically, the market has been a bit off in predicting the path of rate cuts and hikes, and I think this trend will continue in 2025. While Fed policy may be harder to predict given the complexity of the economic landscape, it’s likely that the market will adjust its outlook as new data and trends emerge.
In short, while the current market pricing suggests a more cautious approach, I anticipate that rate cuts will be more significant than what’s being reflected today. This shift could be driven by ongoing economic resilience, political pressures, and the broader trend of easing inflation. Keep an eye on these developments—2025 may end up being a year of more rate cuts than the market currently expects.

The sentiment from the Fed has shifted relatively dovish, and usually, the pricing of the long-term terminal rate tends to track changes in Fed sentiment. However, this time, the market is fading Fed sentiment. As mentioned above, this is because the idea of a hard landing has died, and markets have abandoned the recession narrative. The ability of the U.S. economy to digest higher rates is also a significant factor.
Nevertheless, if the market is correct, you would not want to be long bonds here, as historically, the spread is somewhere around 150bps. So, if we take pricing of around 400bps as a given, you would expect the long-end to be around 525-550bps, give or take.
However, I believe this will start to come down if data eases and inflation continues to decline (even if somewhat sticky), which is largely dependent on what happens with the output gap. I think that into 2025, the output gap will be slightly positive, but I do not see evidence of a resurgence in inflation. Therefore, I expect terminal rate pricing to start to ease.

Inflation
When we talk about inflation, it's easy to focus on the prices of goods like food, cars, or electronics. However, service inflation tends to be a bit stickier, meaning that prices for services rise more gradually and remain higher for longer compared to goods. But why is that the case? Here are a few key reasons why service inflation tends to be stickier.
Many services, such as healthcare, education, or housing, are considered necessities. That means that demand for them is less sensitive to price increases. Even if prices go up, people still need healthcare and housing, regardless of cost. This inelasticity in demand gives service providers more room to raise prices without significantly losing customers. In contrast, goods like luxury items or non-essential products are often more price-sensitive, so demand can drop if prices rise too quickly.
Food has started to push up MoM again and this could lead to inflation having somewhat of a problem easing, and as mentioned the anticipation is for inflation to remain somewhat sticky, but do not expect reacceleration.
Just as with interest rate markets, which have frequently misjudged the trajectory of rate hikes and cuts, inflation forecasts have also consistently been off the mark in recent years. Despite expectations of a quick return to more stable levels, inflation has proven to be much stickier than many analysts anticipated. As we look ahead, I still believe that underlying factors in the economy will keep inflation relatively elevated, hovering around 250bps to 300bps year-over-year for the foreseeable future. The path back to the Federal Reserve's target of 2% inflation will likely take longer than many expect.
Inflation is notoriously difficult to predict, and over the past few years, we've seen just how challenging it is to accurately forecast its movements. The pandemic, supply chain disruptions, geopolitical instability, and shifts in demand have all played pivotal roles in creating a more unpredictable inflationary environment. Initially, many thought the surge in inflation would be temporary, or "transitory," but the reality has been much more persistent.
Markets and economists alike have repeatedly misjudged the inflation data. The belief that inflation would quickly moderate has often clashed with actual outcomes, as inflationary pressures have proved more resilient. This misjudgment is largely due to the complexity of inflation dynamics, which don’t always respond immediately or directly to central bank actions, such as rate hikes.
Even though economic growth has slowed somewhat, demand remains resilient in key areas. Consumers, buoyed by strong labor markets and accumulated savings, continue to spend at levels that keep inflationary pressures alive. Additionally, government stimulus measures and fiscal policies have contributed to higher demand, even as the economy faces headwinds. As long as demand remains strong, businesses will have less incentive to lower prices, perpetuating inflation.
I think this will be largest driver of continued sticky inflation is demand factors as well as what we have seen with increases in prices paid.

Soft Landing Outlook
With rate cuts and approximately 100 days after the first cut, the overall outlook remains for a soft landing or no landing scenario, given what we have observed in previous historical periods. . We should start to see bond yields rally, and I think this is a time to look tactically at being long bonds. I do not see much more momentum for yields to move higher on the long end of the curve.
Tariffs
There is no doubt that tariffs have been at the front of the line in terms of policies that have been zoned in on. Even looking at the Beige book count the mentions of tariffs has gone parabolic. The worry arounds tariffs are driving uncertainty within markets and this does have implications on certain asset classes specifically FX.

The first place we will is the impact on capital flows. The y-intercept is 528.2, which represents the value of Y when X = 0. The slope of the line is 2.778, meaning that for each one-unit increase in X, Y increases by 2.778 units.
The T-statistic of 8.05 indicates strong evidence to reject the null hypothesis. The p-value is essentially zero (3.25E-14), further supporting the rejection of the null hypothesis.
Interestingly, despite an increase in duties, we observe that capital flows rise. This is paradoxical because, in theory, higher duties should restrict trade.
One possible explanation is that nations with large current accounts avoid current account deficits. If a country increases duties, trade partners may face reduced export revenue. However, those nations will continue to export to other countries and need to park the resulting cash somewhere. Since nations running current account surpluses must, by identity, run capital account deficits, they will continue to park cash in other nations.
Firms might also engage in Foreign Direct Investment (FDI) to avoid tariffs, as Japan did under Reagan with its automotive industry.
Additionally, financial flows can increase due to factors other than trade, such as higher interest rates, better investment climates, stronger institutional quality, better regulation, and protection of property rights.
Moreover, as tariffs tend to weaken the affected country's currency, making it less attractive for investment, this can drive capital flows into more stable nations with stronger currencies.
While the R² isn’t very high due to other variables affecting capital flows, the regression still shows that tariffs can lead to an increase in capital flows to a statistically significant degree.

Conventional economic wisdom would suggest that during periods of a high output gap, increased tariffs would have a larger effect.
During periods of a high output gap, there is already a demand-supply imbalance, which puts upward pressure on the price level. When tariffs further restrict supply, it would put additional upward pressure on the price level.
However, the regression finds the opposite to be true.
The low coefficient for the interaction term (Output Gap * Tariff Rate) might initially seem counterintuitive, especially if you expect that a higher output gap combined with a high tariff rate would amplify tariff revenue significantly.
If demand for imported goods is elastic, then higher tariffs combined with a larger output gap might actually reduce the quantity of imports more than expected, which could offset tariff revenue gains.
A higher output gap often indicates an overheated economy, where domestic production and consumption are strong. High tariffs in this environment could incentivize businesses to find alternative sources, reduce import demand, or change supply chains, leading to a smaller-than-expected increase in tariff revenue.
If both tariffs and the output gap are high, the combined effect might suppress trade volumes significantly. For example, businesses might respond by reducing import orders to manage costs, leading to a net decrease in tariff revenue, even if tariff rates are high. This is especially likely if the tariffs are set at a rate where they become a significant barrier to trade rather than just a revenue-generating tool.
Sometimes interaction terms have counterintuitive results due to multicollinearity with other variables. If the output gap and tariff rate individually capture much of the effect on PCE, you will see a reduction in the interaction term as it adds less unique information.
Now to the findings: the p-values for the Output Gap (0.000597), Tariff Rate (0.002), and Interaction (0.019967) indicate the statistical significance of each variable. With p-values below 0.05 for all three variables, we can conclude that the Output Gap, Tariff Rate, and their interaction significantly affect PCE.
The coefficients for the variables show that for each unit increase in the Output Gap, PCE is expected to increase by about 1.237 units, assuming other variables remain constant. For each unit increase in the Tariff Rate, PCE is expected to increase by about 1490.165 units, holding other variables constant. The interaction term’s negative coefficient of -215.093 suggests that when both the Output Gap and Tariff Rate increase together, the impact on PCE is lessened by about 215.093 units.
Tariff Rate is a highly significant predictor with a strong positive effect on PCE, and the Output Gap also has a positive and significant effect on PCE. The Interaction Term suggests that when both the Output Gap and Tariff Rate are high, the effect on PCE is moderated (reduced). Since all predictors except the intercept are statistically significant, we can conclude that the model is robust.
The R-squared value of 0.3561 (or 35.61%) in your multiple regression analysis indicates the proportion of variance in the dependent variable (PCE) explained by the independent variables (Output Gap, Tariff Rate, and the Interaction Term). This means 35.61% of the variation in PCE is explained by the combined effects of the Output Gap, Tariff Rate, and their interaction, leaving about 64.39% of the variance in PCE unexplained by the model. This suggests that other factors outside of these variables also influence PCE.

In the short run, the relationship between tariffs and the NEER is more easily explained by the regression model, as evidenced by the higher R². However, in the long run, this relationship becomes less explanatory as other factors begin to influence the NEER in addition to changes in tariff rates.
This dilution of the tariff's impact leads to a lower R² over time. Despite the lower R² in the long run, the p-value remains statistically significant, indicating that tariff rates still have an impact on the NEER, even over a longer time horizon.
This suggests that while the relationship becomes more complex, the model's coefficient remains statistically significant, and the effects of tariffs on the NEER are both real and meaningful in the long run.
In the short run, the smaller p-value can be attributed to greater volatility in the effects, which increases the degree of noise and variation in the model. This higher variability reduces the p-value relative to the long run. Nevertheless, the regression results confirm that this relationship remains important.
The p-value in the long run is 0.00000603, which indicates a very high level of statistical significance. This small p-value suggests that there is a very low probability that the observed relationship between tariff rates and NEER occurred by random chance, allowing us to deduce that the tariff rate has a meaningful effect on the exchange rate.
The t-statistic of 4.73964 further supports the statistical significance of the relationship, confirming that it is not due to random variation.
The coefficient is 0.51, meaning that for each 1% increase in the tariff rate, the effective exchange rate increases by 0.51%, holding other factors constant. Therefore, we can reject the null hypothesis.
Null hypothesis (H₀): The coefficient of the tariff rate (X) is zero, implying that tariff rates have no effect on the NEER and there is no relationship between the tariff rate and the NEER.
Alternative hypothesis (H₁): The coefficient of the tariff rate is 0.51, meaning that tariff rates do have an effect on the effective exchange rate.
In the short run, the p-value is 0.000256, which is again smaller than the significance threshold of 0.05. This indicates that the null hypothesis can be rejected, meaning there is statistical evidence that tariff rates affect the NEER even in the short run.
The t-statistic of 5.113183 is well above the threshold of 2 for the 95% confidence level, suggesting that the coefficient is significantly different from zero. We can conclude that the tariff rate has a substantial effect on the NEER in the short run, and the coefficient is not due to random chance.
The coefficient of 0.41 means that for each 1% increase in the tariff rate (X), the effective exchange rate (Y) increases by 0.41%. So we can see if tariffs do materialize USD should be a large beneficiary.
(Regression does cluster around 0 as Tariff rate might not change, more stripping out of outliers must be completed. This is a rough draft of highlighting effects).

Equities
Expecting further margin expansion from the S&P as long as unit labor costs can say constrained from the increases in productivity. Unit labor costs represent the cost of labor per unit of output produced. This typically involves dividing total labor costs by the number of units produced or output generated. Lower unit labor costs suggest a company can produce more with the same or fewer labor inputs, which improves profitability and potentially expands operating margins.

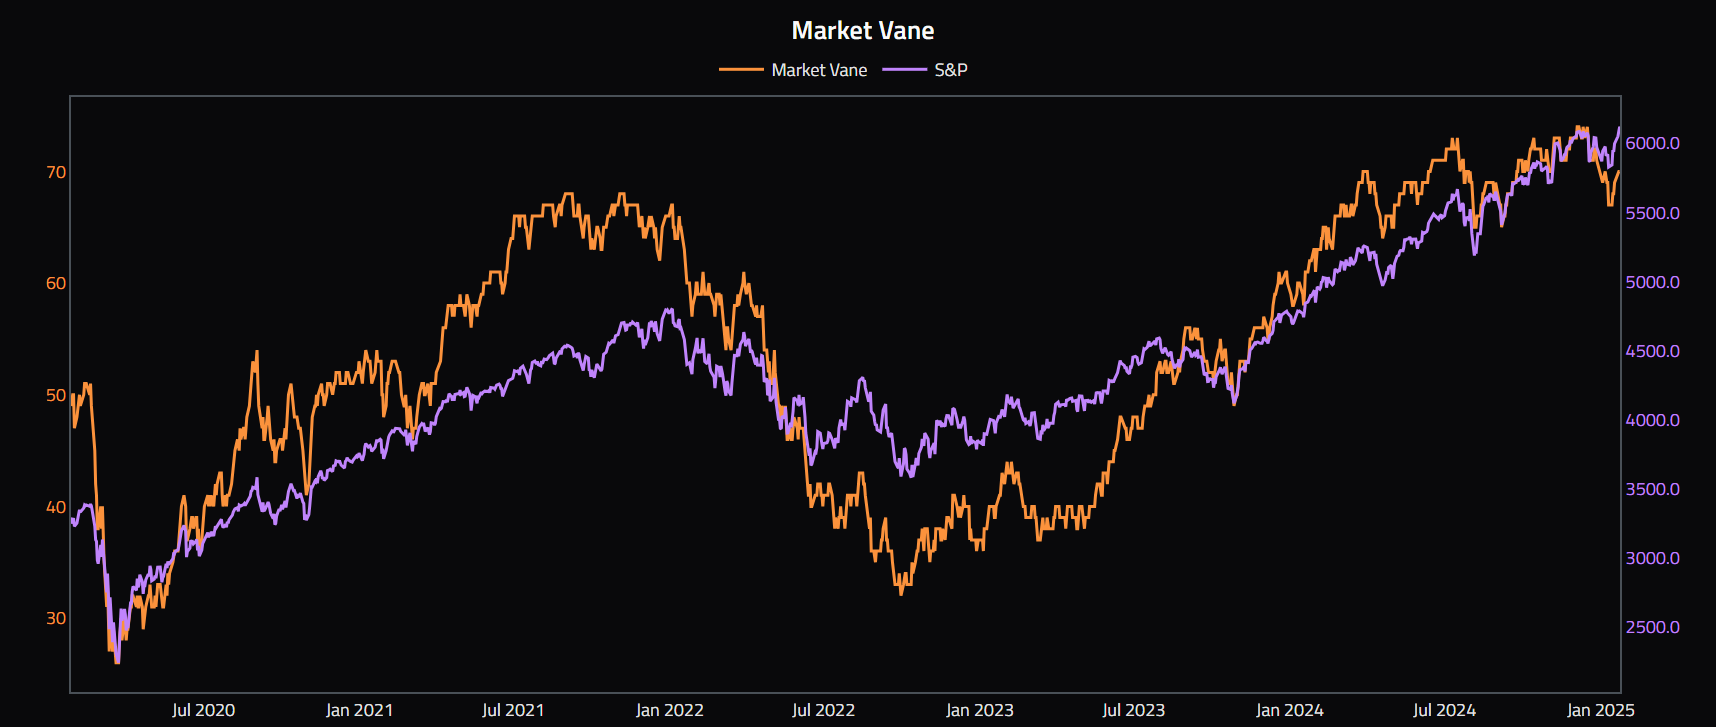
Looking at the ISEE Sentiment Index of the ratio of calls to puts we have seen huge willingness mainly from retail to continue to put risk on at higher levels. So retail options buying continues to be relatively robust and signaling overall bullish sentiment in the market place or one could say complacent. The only headwind I see for equities is the inability to match returns we have seen over the last few years.

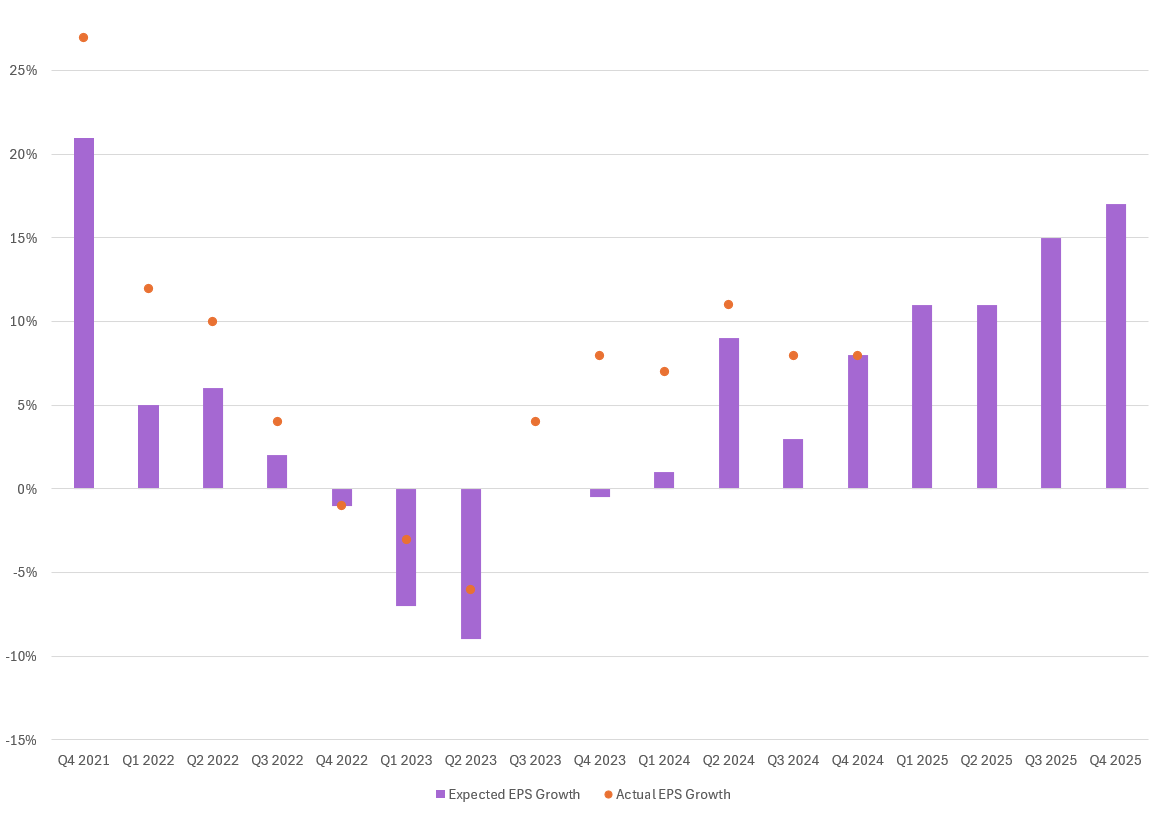
The one benefit that must be mentioned, however, is that, as the famous saying goes, "past performance does not guarantee future results." EPS tends to be expected, and over the last three years, actual EPS growth has come in well above expectations. However, I expect equity growth to ease going forward into 2025, probably around 10% YoY, which is somewhat in line with estimates for the first half of 2025. I can see the trend of this continuing in 2025 mainly if rates are cut quicker than anticipated without signs of weakness in the economy. As I have pointed out above where we can see the path of S&P after rates have been cut.
Market sentiment is also at relatively high levels, with about 70% of participants not bullish. While this doesn't necessarily indicate the direction of the market, I think it somewhat supports the idea of continued flows into the equity markets. We’ve also seen some of the lowest cash reserves for asset managers in years, meaning more and more cash is being allocated to risk-on assets. This should provide momentum into 2025.
Conclusion
In conclusion it looks like the overall outlook for the United States is relatively optimistic. The growth trajectory still looks strong and think that markets will continue to provide returns specifically the FX and rates markets. The equity markets look good as well, but caution is the keyword. I think the only certainty into 2025 is that there will be uncertainty around policy measures whether or political or monetary. However, think overall the backdrop in the USA will continue to support flows into US assets.