Given the current growth dynamics in the United States, we are seeing significant strength. Many people continue to view the United States as a country that may be weakening, with data appearing to fall short of expectations. However, I would disagree with this assessment. In this post, we will discuss the economic outlook, examine interest rates, and consider expectations for the S&P 500. This will be an all-inclusive post highlighting various macroeconomic topics as they relate to the United States.
Economic Robustness Relative to Expectations
The first thing we need to highlight is what we're seeing with expectations and rate cuts.
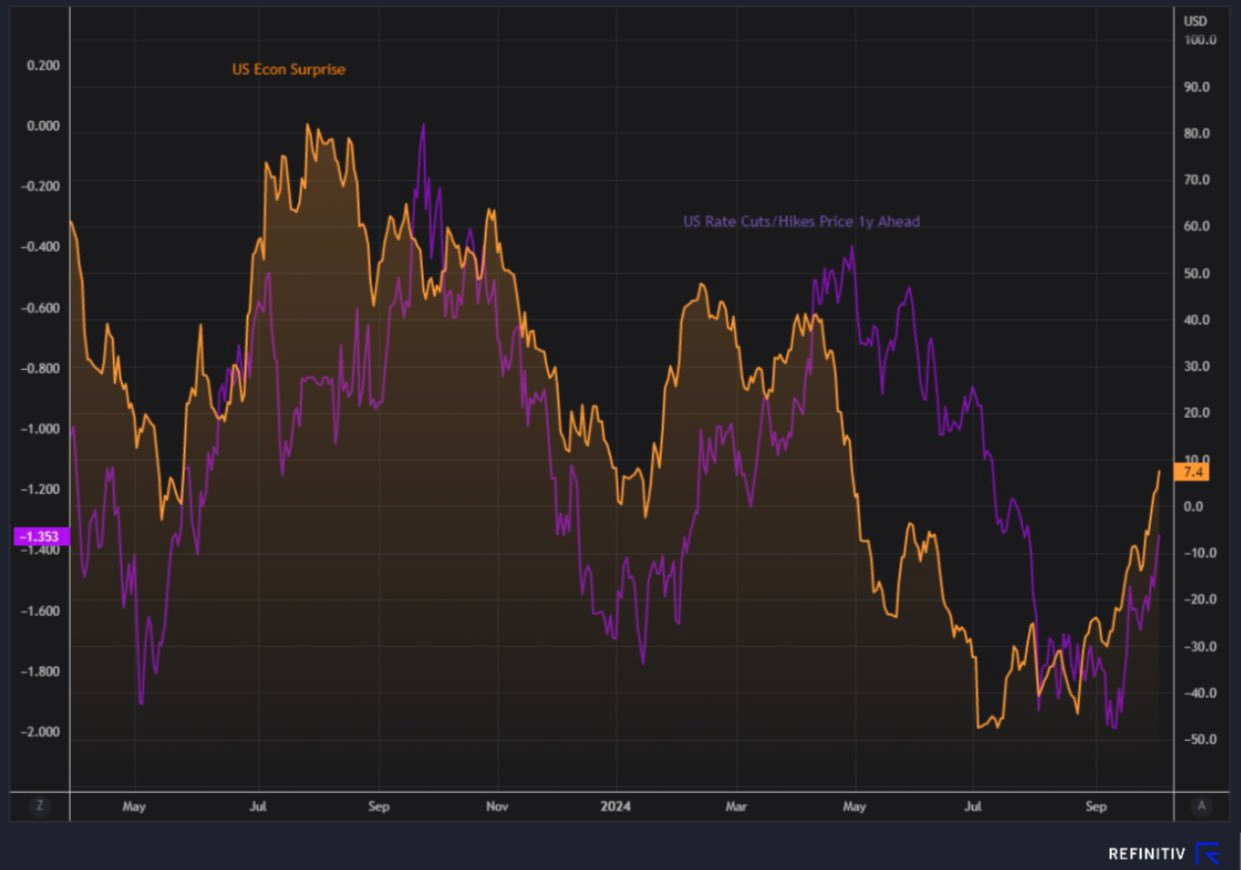
We’ve seen rate cuts rapidly priced out over a one-year forward horizon, with markets now expecting about 100 basis points of cuts over the next year. This is down from 175 basis points of cuts previously priced in. The magnitude of beats relative to expectations is significant, meaning that data is coming in much better than forecasted.
The way I measure this is with the following formula:
Standard Surprise=(Actual Value-Forecast Value)/Standardized Deviation of Historical Forecast Error.
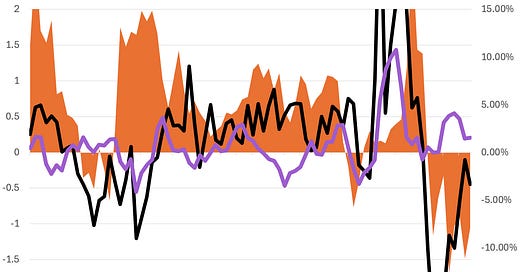
The magnitude helps highlight how unexpected the result is based on historical patterns. The magnitude we’ve seen in unemployment data emphasizes that the labor market remains tight.
On the economic front, data continues to surprise to the upside relative to forecasts. Given this, expect more rate cuts to be priced out of the forward curve unless there is a significant change in the data.
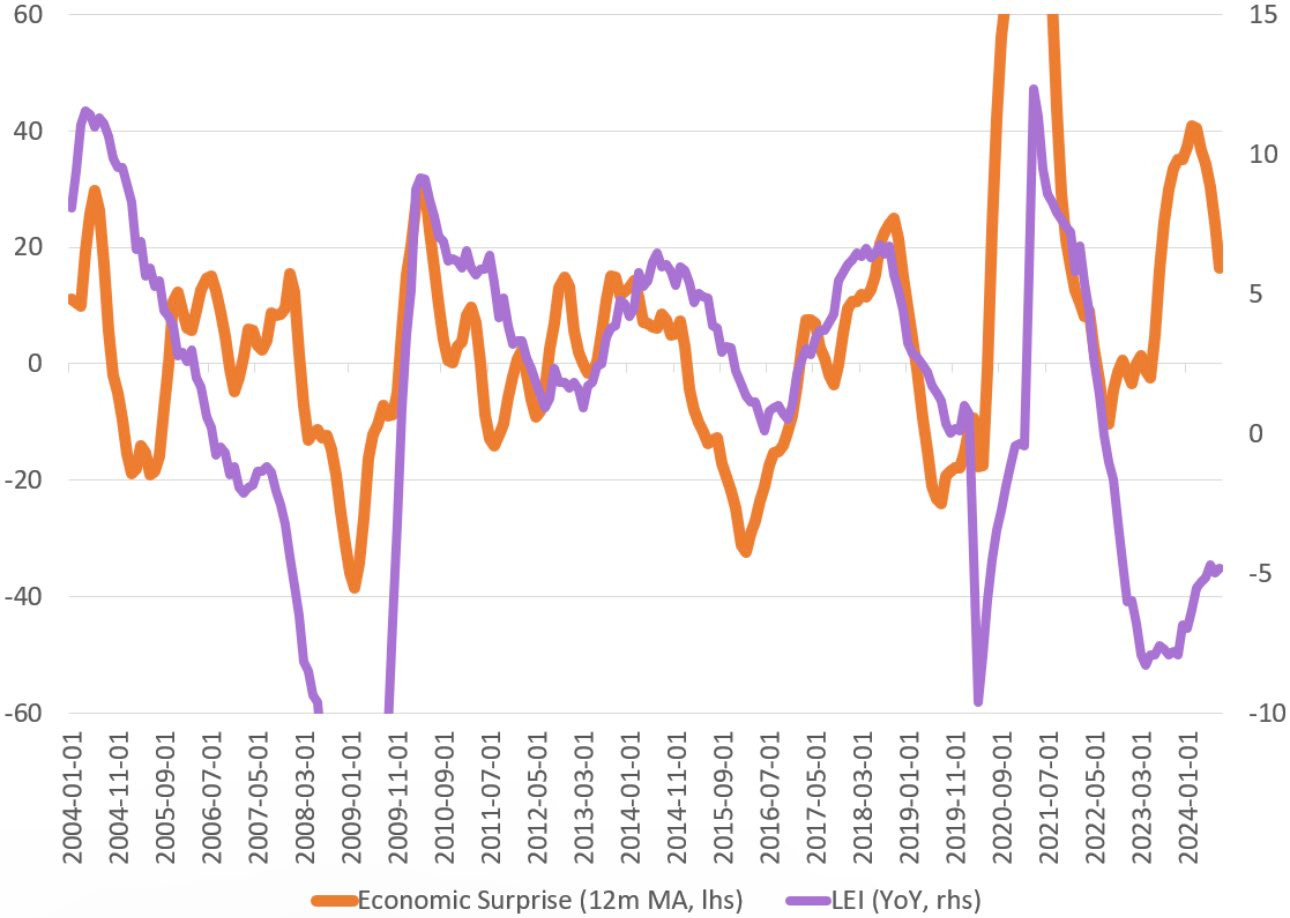
The Leading Economic Index (LEI) is designed to predict longer-term trends in economic activity, while the Citi Economic Surprise Index measures short-term expectations relative to actual economic data. Despite their differences, the two indices tend to move in sync. I would argue that short-term expectations often feed into longer-term expectations of economic activity. Given the significant upward momentum in recent short-term economic activity, I expect the LEI to start moving higher, away from the current pessimism. Notably, this recent reading marks the first time the LEI has diverged significantly from its historical accuracy.
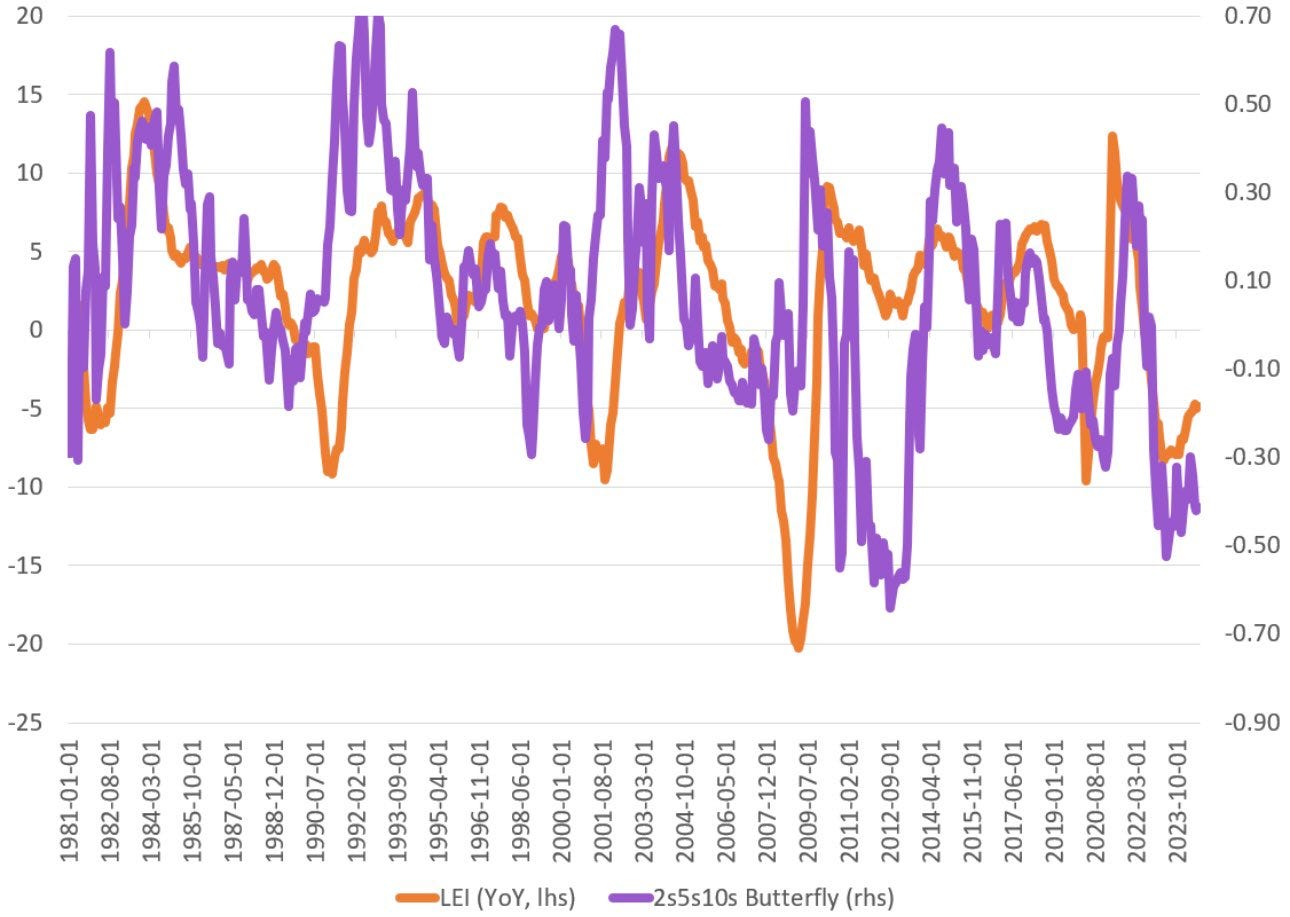
Historically, when the 2s5s10s butterfly falls below -20 basis points, it often coincides with a recession. However, this time, I don’t believe it is the primary driver.
The 2s5s10s butterfly is a bond market term that refers to the relative value trade between the 2-year, 5-year, and 10-year U.S. Treasury yields. This “butterfly” strategy measures the curvature of the yield curve by comparing the yield of the 5-year Treasury note to the average of the 2-year and 10-year Treasury yields.
Giving credit to @EffMktHype for providing insight on this, highlighting that much of the current movement is being driven by the relative richness of the 5-year note compared to the cheapness of the wings (the 2-year and 10-year notes).
If the 5-year note continues to aggressively price in rate cuts, it will become even more rich, further depressing the butterfly spread.
The magnitude of the Citi Economic Surprise Index shows that economic data is coming in much better than expected.
As a result, the market’s pricing for interest rate cuts one year ahead has adjusted, moving from expectations of 200 basis points of cuts to around 135 basis points over the next 12 months.
There was too much pessimism surrounding U.S. growth around September, and now that is being repriced as the outlook for U.S. growth remains strong.
S&P 500 Outlook
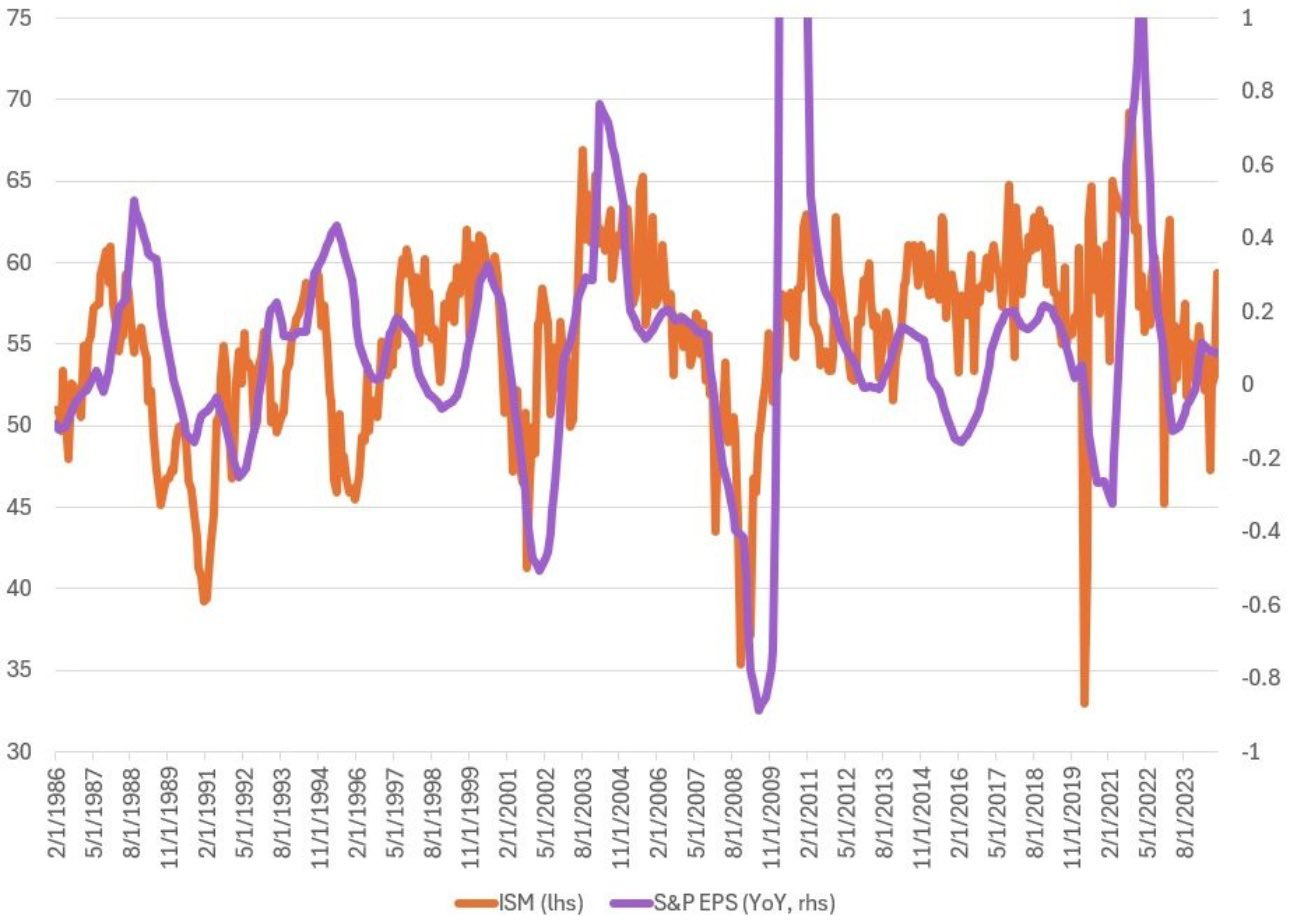
The recent increase in the ISM should continue to support profits and earnings through the end of the year. While the ISM is technically still below the expansion threshold (under 50), we have continued to see relatively strong EPS growth.
Unless there is a significant slowdown, the revival we’ve seen in other areas of the ISM, particularly new orders, should support the base case for solid profit growth among U.S. companies. Considering current demand and the rate of change in the ISM, this suggests a relatively optimistic base case for an improved economic outlook.
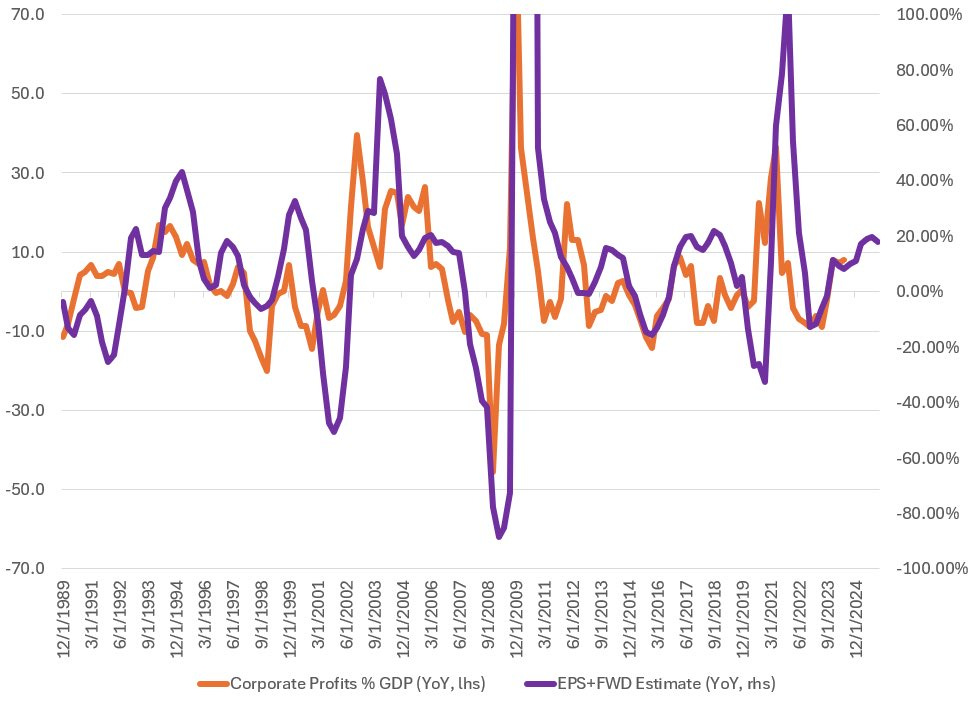
Corporate profits are rising well above the trend of the past decade. Earnings and profits have not yet peaked, as we can expect positive forward EPS growth.
I don’t anticipate profits peaking because the U.S. economy hasn’t reached what Keynes would refer to as the "effective demand limit."
The effective demand limit is the threshold beyond which businesses do not see enough consumer demand to justify further expansion of output, hiring, or investment, regardless of their capacity to do so. At this point, even if supply-side factors (such as labor or capital) are available, firms will not increase production because there is not enough demand to buy the additional goods or services.
The effective demand limit occurs when firms expect no further increase in aggregate demand. At this point, businesses stop expanding, investment slows down, and economic growth can stagnate. This can happen even if the economy is not fully employing its labor force or using all its productive capacity.
In practical terms, when the U.S. economy hasn't reached the effective demand limit, there is still potential for increased consumer spending, investment, and business activity. This means companies can continue to grow profits and earnings because demand for their products and services is still expanding.
This suggests we have not yet hit an inflection point in the business cycle, indicating that solid growth from U.S. companies should continue. Forward EPS projections show that profits still have room to grow.
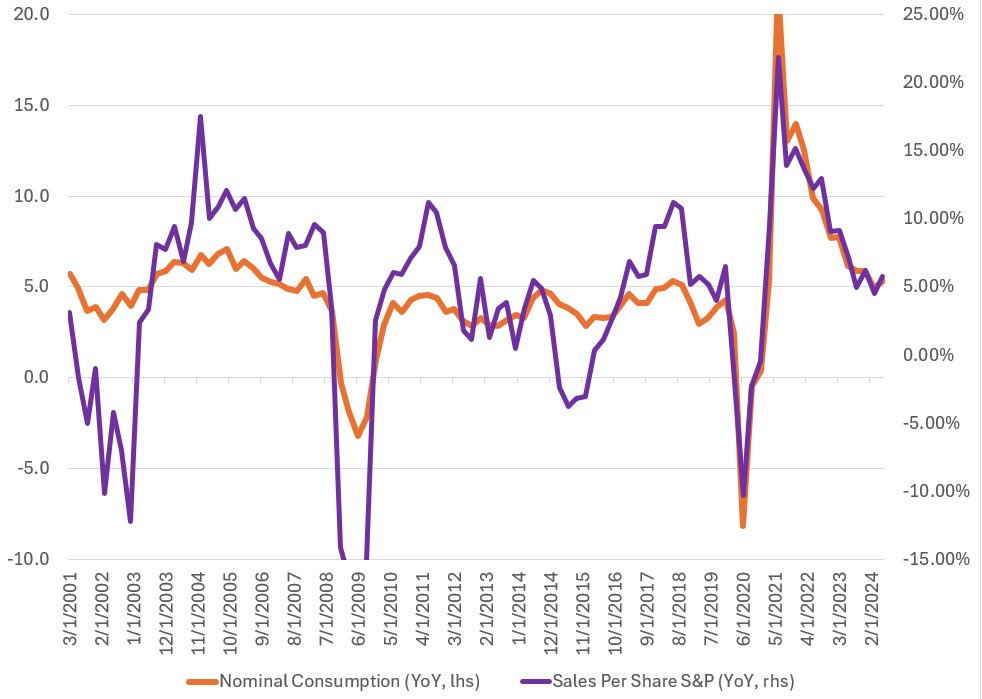
Sales per share for the S&P 500 is currently about in line with the historical average. Sales per share is calculated as revenue divided by total shares outstanding, making it an indicator of a company's revenue-generating capacity.
It is closely tied to overall nominal consumption, as increased consumption, particularly in consumer-driven sectors, leads to higher revenue.
Given the expectation of robust consumer spending, driven by a higher marginal propensity to consume (MPC), I expect revenue to remain relatively stable.
It’s important to note that sales per share alone doesn’t provide a complete picture, but when we also consider where EPS stands for the S&P 500 in aggregate, I don’t see a strong bear case here.
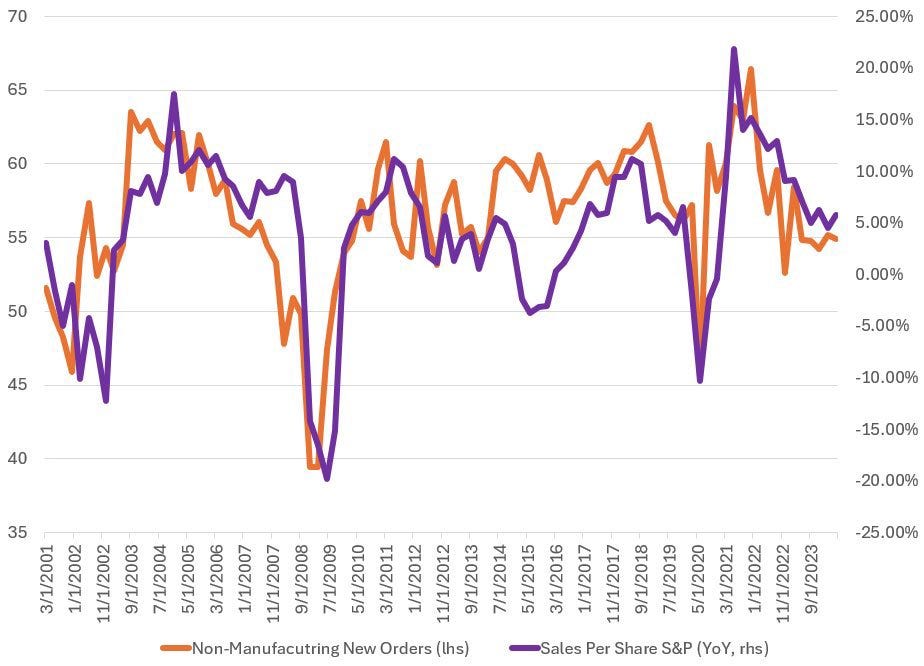
The ISM Non-Manufacturing New Orders Index and Sales Per Share share a causal relationship that stems from how new business activity in the services sector drives revenue generation for companies, particularly in the S&P 500, and eventually affects their reported sales per share.
When the ISM Non-Manufacturing New Orders Index rises, it reflects an increase in demand for goods and services in the economy, especially in consumer-driven sectors. This leads to higher revenues for companies in the services industry, which make up a substantial part of the S&P 500.
As new orders come in, businesses must ramp up production or service delivery to meet this demand, resulting in higher sales. For example, when consumers increase spending on retail, travel, or healthcare services, companies in these sectors see higher revenues.
Over time, these increased revenues translate into higher sales per share, as the company's total sales grow.
The services sector is closely tied to consumer spending which represents a large portion of economic activity in the U.S. When consumers spend more on services, such as dining out, travel, healthcare, or financial services, companies in these sectors experience increased orders and revenues. This increase in revenue eventually boosts sales per share.
An uptick in new orders, captured by the ISM Non-Manufacturing New Orders Index, is often an early indicator of robust consumer demand, which flows directly into the revenue streams of service-sector companies.
Since sales per share is driven by the total revenue divided by the outstanding shares, the relationship between a surge in new orders and higher revenues directly causes an increase in sales per share, assuming the number of shares remains relatively constant.
The ISM Non-Manufacturing New Orders Index acts as a leading indicator for future revenue generation. New orders represent future business, meaning that companies anticipate future sales based on the number of orders they have received. Therefore, when the index shows a strong increase in new orders, it suggests that businesses in the services sector will likely report stronger revenues in the coming months.
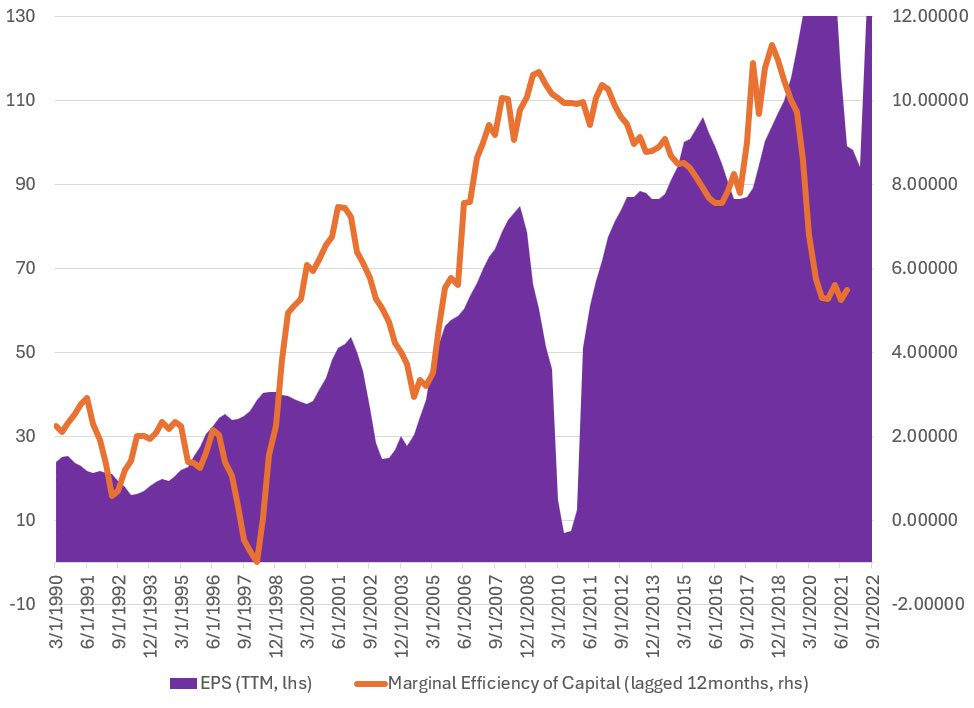
The relationship between Keynes' idea of the Marginal Efficiency of Capital and Earnings Per Share for companies in the S&P 500 is rooted in how investment decisions influence corporate profitability and growth. Let’s break down the concepts and their interplay.
The marginal efficiency of capital, as described by John Maynard Keynes, refers to the expected return on an additional unit of capital investment. It is essentially the rate of return anticipated from investing in new capital goods, such as machinery, buildings, or technology. If the MEC exceeds the cost of capital (the interest rate or required return), businesses are incentivized to invest.
When businesses find the MEC attractive, they will increase their capital expenditures (CapEx) to expand production, improve efficiency, or develop new products. Conversely, if the MEC is low or negative, firms may hold back on investments, which can lead to stagnant or declining growth.
When the MEC is high, firms are more likely to invest in new projects and capital goods. This leads to increased production capacity, efficiency, and innovation. As a result, companies can generate higher revenues and profits, contributing to an increase in EPS.
During periods of economic expansion, the MEC tends to rise as business confidence improves. This encourages firms to invest, which can lead to a surge in EPS as companies capitalize on increased consumer demand. Conversely, during economic downturns, the MEC may decline, leading to reduced investment and potentially stagnant or falling EPS.
Sustained high levels of investment and a favorable MEC contribute to long-term growth in EPS for S&P 500 companies. Investments in new technology, infrastructure, and workforce development can lead to significant improvements in productivity and profitability over time.
While the marginal efficiency of capital (MEC) has eased, it remains positive, indicating that new investments are likely to generate significant returns and encouraging companies to invest more. This can lead to increased production capacity and higher revenues, ultimately boosting EPS.
If the cost of capital is low relative to the MEC, companies are more likely to invest in growth initiatives, improving future earnings and, consequently, EPS.
So, what is the marginal efficiency of capital? Essentially, it indicates that when firms are pushed against the real interest rate, they will maintain enough inflation in pricing to avoid falling below the cost of the real rate. This holds true, provided there is relative inelasticity of demand.
If profits or returns begin to fall below the cost of the real interest rate, firms will raise prices.
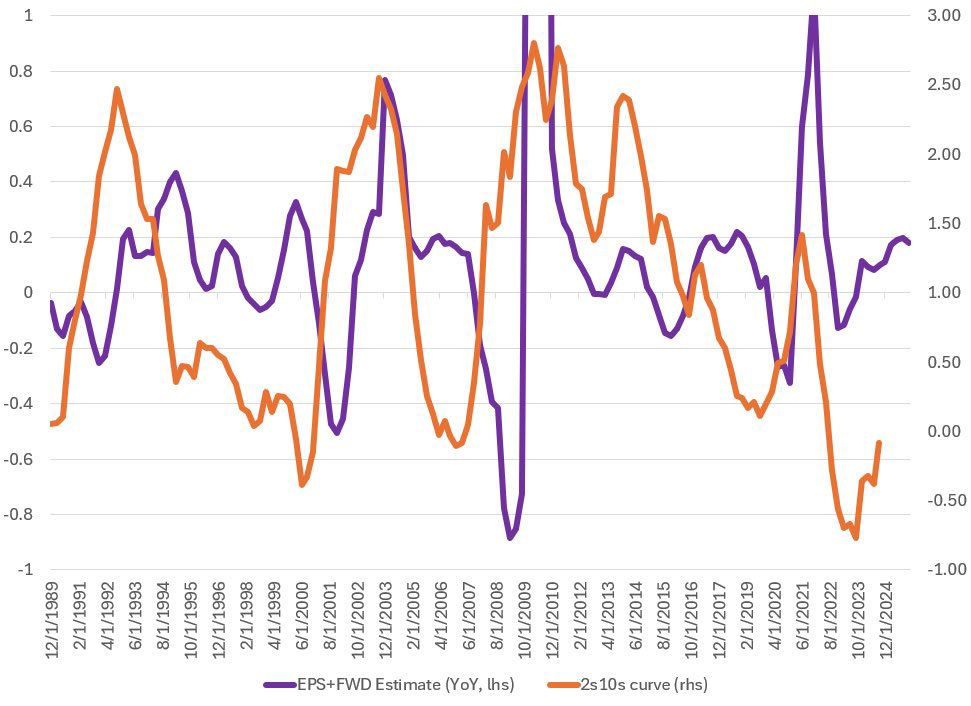
The relationship between the 2s10s yield curve and EPS is complex and influenced by various factors, including interest rates, economic growth expectations, and market sentiment. A steep yield curve generally supports higher EPS through lower borrowing costs, increased investment, and enhanced economic growth. Conversely, an inverted yield curve can signal economic uncertainty and dampen corporate profitability, potentially leading to lower EPS.
The shape of the yield curve directly influences interest rates and, subsequently, the cost of capital for businesses. When the yield curve is steep (meaning the spread is wide), companies can borrow at relatively low short-term rates while benefiting from higher long-term rates when financing new projects or investments.
A steepening yield curve generally reflects optimism about future economic growth. When investors expect strong economic performance, long-term interest rates rise relative to short-term rates, indicating confidence in corporate earnings.
The 2s10s spread can also influence market sentiment and risk appetite among investors. A positive yield curve typically encourages risk-taking behavior, leading investors to favor equities over fixed-income investments.
When this ratio increases, it indicates that a company is holding more inventory relative to its sales. This can happen for many reasons. Overproduction the company may have produced too much product, anticipating higher demand that did not materialize. Decreasing consumer demand can lead to higher inventory levels as products accumulate without being sold.
Companies with a low inventory-to-sales ratio often demonstrate strong operational efficiency, translating to higher sales per share. Efficient inventory management can help reduce carrying costs and improve profit margins, benefiting overall financial performance.
A high inventory-to-sales ratio may signal potential issues in sales forecasting, production planning, or market demand. It could lead to increased carrying costs, potential markdowns, or write-offs, ultimately affecting profitability and sales per share.
Investors typically view a lower inventory-to-sales ratio as a positive sign, indicating that a company is agile and responsive to market demand. This perception can drive stock prices higher, thereby enhancing sales per share as the company’s market capitalization grows.
Changes in the inventory-to-sales ratio can serve as an economic indicator. A rising ratio during a period of economic expansion may signal that companies are overestimating demand, while a falling ratio in a downturn could indicate that companies are effectively managing inventory in response to reduced sales.
The valuation model I created for the S&P 500 examines the value creation of companies in aggregate. This value creation provides insights into the expectations that determine stock prices. Stock prices reflect the expectation of future cash flows.
Within this model, we can see that it tracks the returns of the S&P 500. The reason is that, in aggregate, we look at sales growth. The sales growth rate directly influences corporate revenues. When the economy expands, consumer spending typically increases, leading to higher sales for S&P 500 companies.
Operating profit margins reflect how effectively companies in the S&P 500 manage their costs relative to their sales. Higher margins usually correlate with better profitability, which can attract investors and drive up stock prices.
Companies with strong operating profit margins are often viewed favorably during earnings reports, potentially leading to positive market reactions. This model can provide a forecast of profitability based on historical data, aligning expectations with actual performance.
Increased capital expenditures indicate that companies are investing in future growth opportunities. This can signal to investors that management is optimistic about future demand and profitability, positively influencing stock valuations in the S&P 500.
In periods of economic expansion, higher capital expenditures can lead to growth in corporate earnings, further driving S&P 500 performance. Conversely, during economic downturns, reduced spending can signal caution and lead to lower stock prices.
Adequate working capital suggests that companies can meet their short-term obligations, which is crucial for operational stability. Investors may interpret a strong working capital position as a sign of financial health, thus driving stock prices higher.
Companies with efficient working capital management can convert assets into cash quickly, which can enhance their overall financial stability and attractiveness to investors, positively impacting their stock performance.
The variance in individual stock returns at any given moment serves as a critical measure of cross-sectional uncertainty within the financial markets. Mathematically, if we denote the returns of N individual stocks at time t as R1(t),R2(t),…,RN(t) the sample variance σ^2 of these returns can be expressed as:
where R(t) is the mean return at time t. A higher variance indicates greater dispersion of stock returns, reflecting increased uncertainty among investors regarding future performance.
Economic shocks that cannot be adequately modeled often lead to significant changes in business cycle dynamics. These unmodeled shocks may include factors such as geopolitical events, sudden regulatory changes, or unexpected shifts in consumer behavior, all of which can profoundly impact investor sentiment and firm performance.
The standard deviation σ, which is the square root of the variance, can provide valuable insights into the overall distribution of stock returns across firms. A larger standard deviation signifies a broader cross-sectional distribution of returns, suggesting heightened uncertainty about the economic environment. This increased dispersion can serve as a leading indicator of changes in the business cycle, as it may reflect diverging expectations among investors regarding future economic conditions.
The skewness of the distribution of returns, defined mathematically as:
measures the asymmetry of the return distribution. It provides insight into the equilibrium between upside and downside risks facing firms. A positively skewed distribution indicates that there are more instances of extreme positive returns, suggesting optimism among investors. Conversely, a negatively skewed distribution signals a higher likelihood of extreme negative returns, reflecting heightened downside risk.
This is displayed below, along with GDP, and one can see how these two closely follow each other. Therefore, I would have to disagree with anyone who says that the stock market is not the economy to some extent. There is a wealth of information that can be gleaned from the mathematical breakdown, particularly regarding its role as a leading indicator for the business cycle, as denoted by GDP.
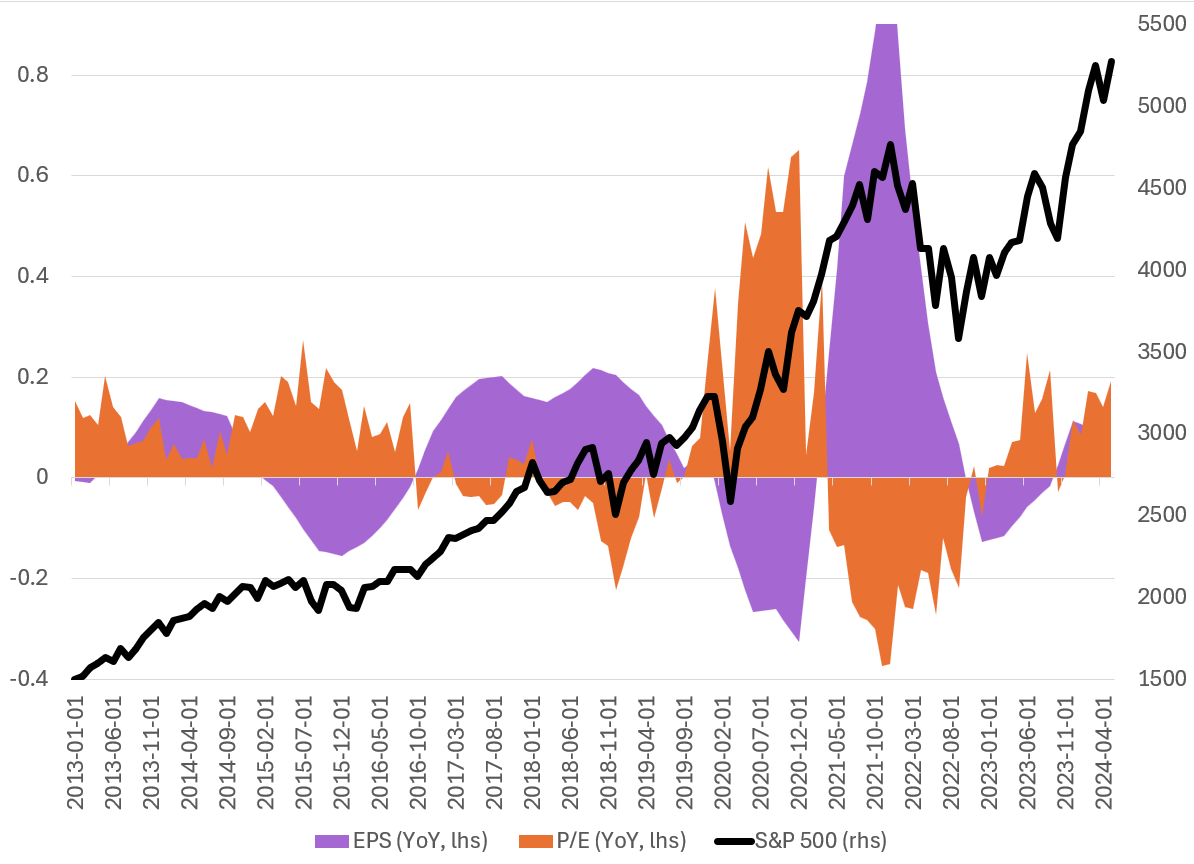
The recent returns in equity markets have mainly been driven by P/E multiple expansion. For a long time, the primary driver of equity market returns has been the expansion in P/E multiples. There have even been instances where positive returns were achieved despite negative EPS growth on a year-over-year basis. Even as we move away from ZIRP and short-term rates hover around 400 basis points, multiples continue to expand. While some may believe that valuations are stretched, I do not share this view, and there is a reason for this.
Earnings have remained relatively stable, with companies able to pass costs onto consumers due to the inelasticity of demand. Later in this article, I will also discuss earnings potential, as there remains a relatively high propensity to consume, and consumer inflation expectations over the next 5-10 years remain elevated. This suggests a continued pull-forward of demand, meaning that price increases—at least marginally—will still be digestible by consumers, supporting future earnings.
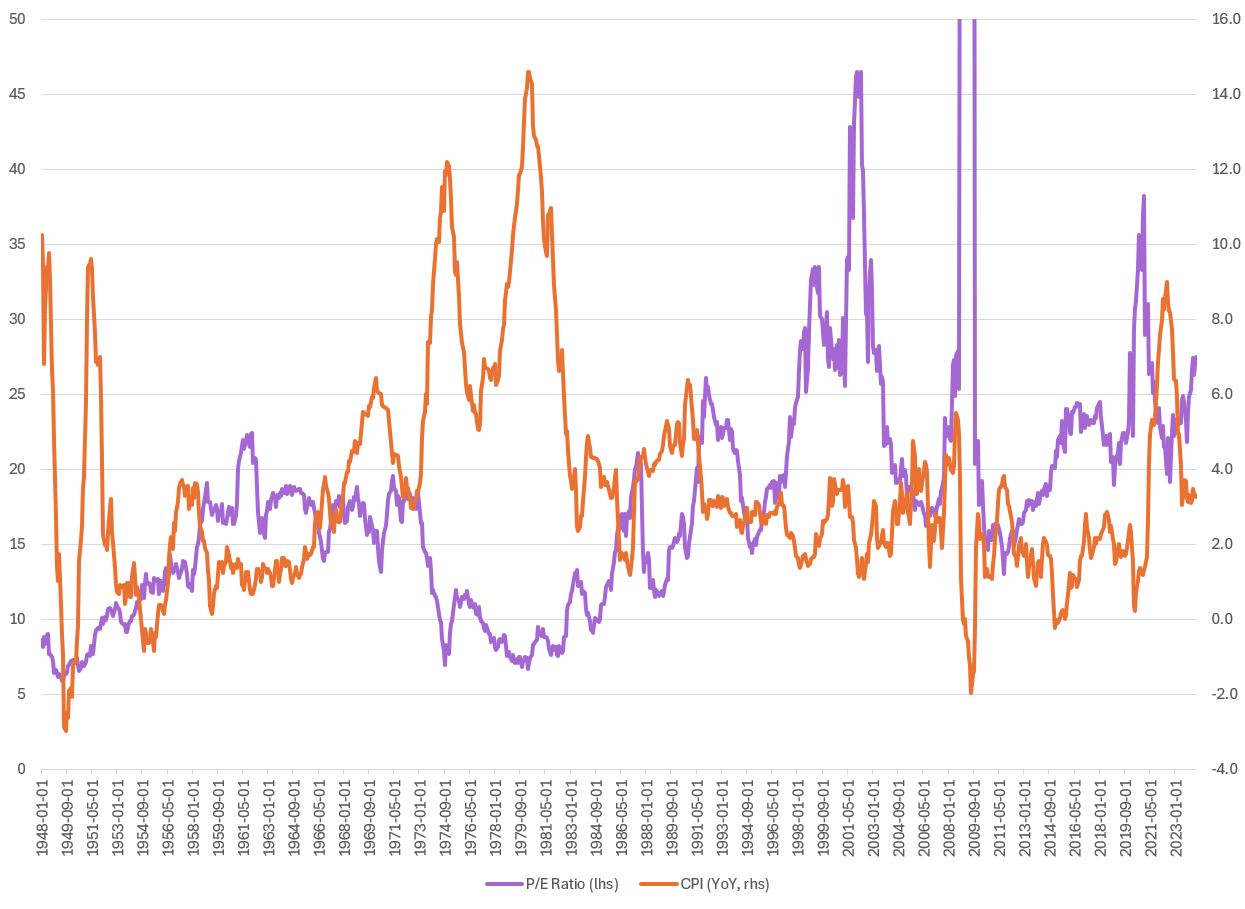
There is an inverse relationship between the S&P 500 P/E ratio and inflation stems from how inflation affects both corporate earnings and investor sentiment toward future earnings.
When inflation rises, the cost of inputs rises, which erodes profit margins for companies. As costs for labor, raw materials, and other inputs rise, firms may struggle to maintain profitability, especially if they cannot fully pass these costs on to consumers. This leads to lower expected earnings, which can result in a lower "E" (earnings) in the P/E ratio. When earnings are expected to decline or grow more slowly due to inflationary pressures, investors are less willing to pay high multiples, leading to a decrease in the "P" (price), or a contraction in the P/E ratio.
Valuing stocks involves discounting expected future earnings or cash flows. Inflation and higher interest rates increase the discount rate applied to these future earnings. As a result, the present value of future earnings diminishes, making equities less attractive at current prices. Investors are unwilling to pay high multiples for future earnings that are worth less in today's terms due to inflationary pressures.
Historically, periods of high inflation have often coincided with lower P/E ratios for the S&P 500. For example, in the 1970s, when inflation was elevated, the S&P 500's P/E ratio was significantly lower compared to periods of low inflation and stable economic growth, such as in the 1990s and early 2000s when P/E ratios were much higher.
Inflation
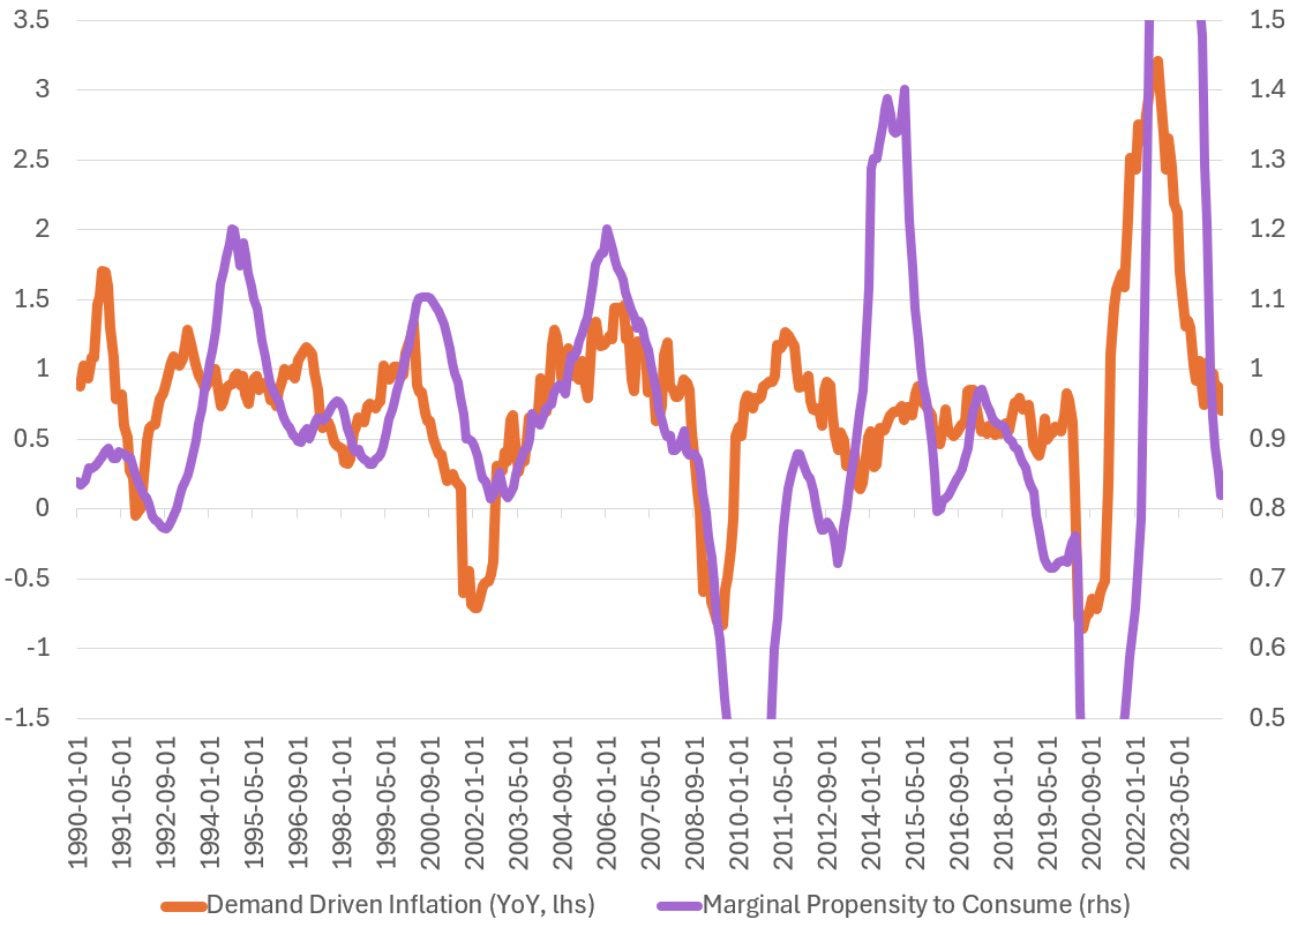
The University of Michigan's data on expected changes in prices over the next 5-10 years versus the marginal propensity to consume (MPC) is crucial.
The graph shared by @ces921 highlights how inflation expectations influence consumer spending psychology.
The marginal propensity to consume is closely linked to changes in inflation expectations. While the correlation isn't perfect, there is a clear trend where rising inflation expectations lead to increased consumption from each additional dollar of disposable income.
In theory, the MPC should range between 0 and 1. However, it can occasionally fall below zero or exceed 1 due to factors like credit utilization.
This can boost current consumption in the short term, resulting in an MPC over 1, but may lower future MPC due to debt repayment obligations. Currently, with elevated inflation expectations, the MPC stands at around 0.9.
This means that for every dollar of disposable income, consumers will allocate 90 cents to consumption and 10 cents to savings.
This insight is significant for understanding consumer behavior psychology. It also raises concerns for the Federal Reserve regarding long-term inflation management.
Historically, Canada faced a similar issue in the 1990s when the Bank of Canada drastically raised interest rates to combat inflation.
This approach was ineffective, leading to confusion among policymakers. A subsequent survey revealed that consumers expected inflation to remain high, prompting them to pull forward demand and contributing to persistent demand-pull inflation.
Ultimately, this underscores the challenge central banks face: if they cannot induce demand destruction, their tools may be ineffective.
This appears to be the current situation, suggesting that consumption in the U.S. is likely to remain robust in the future.
Demand-pull inflation, which arises when aggregate demand outpaces the economy's ability to supply goods and services, is returning to its historic average. This shift follows a period of easing consumption, but the gap between demand and supply persists. As a result, the economy struggles to produce adequate goods and services to meet demand, which contributes to ongoing inflationary pressures.
One key factor driving this dynamic is the marginal propensity to consume (MPC). When inflation expectations rise, as highlighted yesterday, consumers anticipate higher prices in the future and adjust their spending behavior accordingly. They often accelerate their purchases to avoid paying more later, increasing current consumption and pushing up demand further.
The relationship between inflation expectations and MPC is significant. Historically, when consumers expect higher inflation over a longer period, such as the next 5-10 years, their MPC tends to increase. This means a larger portion of any additional income is directed toward consumption rather than savings. In times of heightened inflation expectations, consumers may spend more of each dollar they receive, often well above the usual MPC range of 0 to 1. This can happen through credit utilization or reduced saving, effectively leading to an MPC greater than 1 in the short term.
As consumers pull forward their demand in response to anticipated price increases, this fuels demand-pull inflation. Higher consumption levels, coupled with the economy's limited ability to expand supply quickly, create inflationary pressure. In the long run, this cycle can become self-reinforcing, especially if consumers believe inflation will remain elevated. As demand rises, businesses face higher production costs, which they pass on to consumers in the form of higher prices, sustaining inflation.
Therefore, the current return of demand-pull inflation to historic levels is closely tied to inflation expectations and the accompanying rise in MPC. If consumers continue to expect higher inflation over the next 5-10 years, as recent data suggests, their spending patterns may continue to stoke demand-pull inflation, complicating central banks' efforts to control price increases through monetary policy. This poses a significant challenge, as inducing demand destruction—typically through higher interest rates—may not be effective if consumer psychology remains anchored in expectations of persistent inflation.
Geopolitical risks are increasingly pushing up supply chain inflation, contributing to broader inflationary pressures across the global economy. The primary drivers of these increased supply chain costs stem from rising input prices, such as raw materials, energy, and labor, as well as escalating freight and logistics expenses. As global supply chains become more fragile, disruptions from geopolitical tensions further exacerbate these cost pressures, making cost-push inflation harder to control.
Geopolitical risks can arise from various sources, such as trade wars, sanctions, military conflicts, and political instability in key manufacturing or resource-rich regions. For example, rising tensions in the Middle East and disruptions in the Red Sea, a critical maritime shipping route, have contributed to higher freight costs. While these shipping costs have eased slightly in recent months, geopolitical tensions remain elevated, contributing to ongoing uncertainty in supply chain logistics.
The Geopolitical Risk Index (GPR) helps measure the influence of such tensions on global markets. When geopolitical risks rise, companies face disruptions to their supply chains, either through direct interruptions like shipping blockades or sanctions, or indirectly through higher insurance premiums, delays, or rerouting of goods. These disruptions lead to increased costs for transporting goods, which are ultimately passed on to consumers and businesses, contributing to supply chain inflation.
This type of inflation is known as cost-push inflation, where rising production costs drive up overall prices. Unlike demand-pull inflation, which stems from increased consumer demand, cost-push inflation is often more stubborn. In the short run, it is particularly challenging to reduce because businesses must still absorb higher costs for inputs like fuel, commodities, and labor, even if demand for their goods remains stable or decreases.
Geopolitical risks, by constraining supply chains, contribute to making the aggregate supply curve more inelastic in the short run. Inelasticity means that the supply of goods and services cannot respond flexibly to changes in price or demand. When geopolitical disruptions limit the availability of inputs or raise transportation costs, firms have little room to increase production, even if prices rise. The inelasticity of supply means that even modest increases in demand can lead to sharp price hikes, further fueling inflation.
Moreover, geopolitical tensions often have prolonged impacts on supply chains. For example, trade barriers or conflicts in critical regions can disrupt the flow of goods over extended periods, leading to sustained cost increases. These geopolitical shocks can also lead firms to shift production to higher-cost locations, further embedding inflationary pressures into the economy.
The persistence of cost-push inflation due to geopolitical risks creates significant challenges for policymakers. Central banks, which typically combat inflation through monetary tightening, find it difficult to address inflation driven by supply-side constraints. Raising interest rates can suppress demand, but it does little to alleviate the supply shortages or rising input costs caused by geopolitical tensions. As a result, inflation may remain "sticky" in the short run, even as central banks attempt to rein it in.
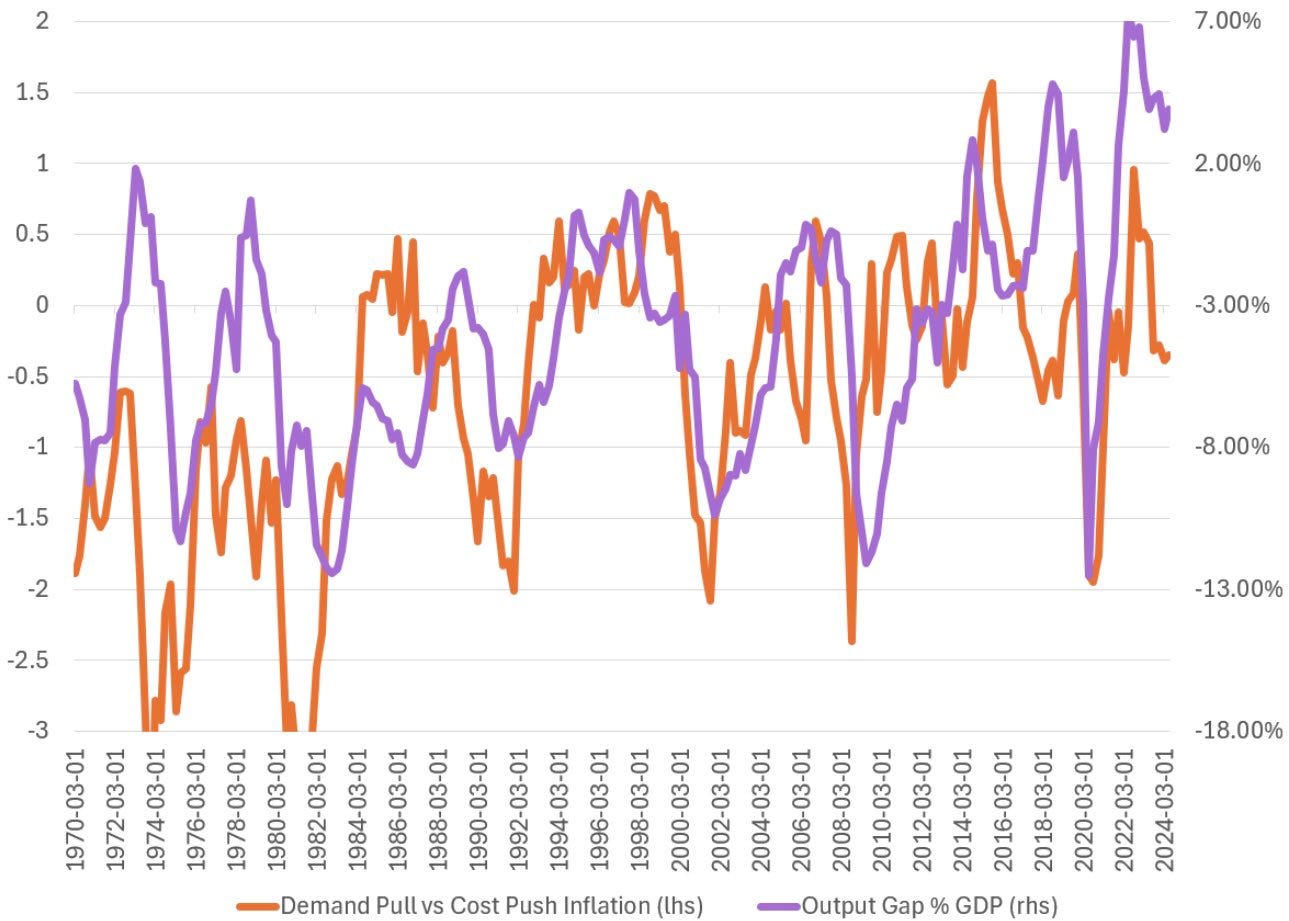
The concepts of the output gap, demand-pull inflation, and cost-push inflation are interconnected within macroeconomic theory, particularly in discussions about inflationary pressures and the overall health of an economy.
The output gap measures the difference between the actual output of an economy (Gross Domestic Product, or GDP) and its potential output. Potential output is the level of production an economy can sustain over the long term without causing inflation, assuming all resources (labor, capital, etc.) are fully and efficiently utilized.
A positive output gap occurs when actual GDP exceeds potential GDP. It indicates that the economy is operating above its sustainable capacity, with demand outpacing the economy's ability to produce goods and services. In this situation, upward pressure on prices is created because businesses struggle to meet excess demand. This scenario is often associated with demand-pull inflation.
A negative output gap occurs when actual GDP is below potential GDP, meaning the economy is operating under capacity with underutilized resources (such as unemployed labor or idle factories). In this case, there is no significant upward pressure on prices because supply exceeds demand. If inflation occurs during a negative output gap, it may be driven by factors outside of demand, such as cost-push inflation.
When demand-pull inflation occurs, the aggregate demand (AD) curve shifts to the right, indicating that the economy is producing more than its potential capacity. In this case, the aggregate supply (AS) curve may remain relatively elastic in the short term, allowing businesses to increase output without immediate price hikes. However, as the economy nears full capacity, the AS curve becomes steeper and more inelastic, meaning that further increases in demand lead to sharp increases in prices (inflation) rather than a proportional increase in output.
Cost-push inflation directly shifts the short-run aggregate supply (SRAS) curve to the left, reflecting a reduction in the quantity of goods and services that businesses are willing to supply at existing price levels due to higher costs. This causes inflation even without an increase in demand. Because of this shift, the AS curve becomes more inelastic, reflecting the difficulty for businesses to adjust supply quickly in response to rising costs.
Currently we are seeing a relatively elevated output gap at almost 5% of GDP. This indicates that the economy is running hot. We could start to potential see a rise again in inflation, and this has been denoted in inflation swap markets. Which will be discussed shortly.
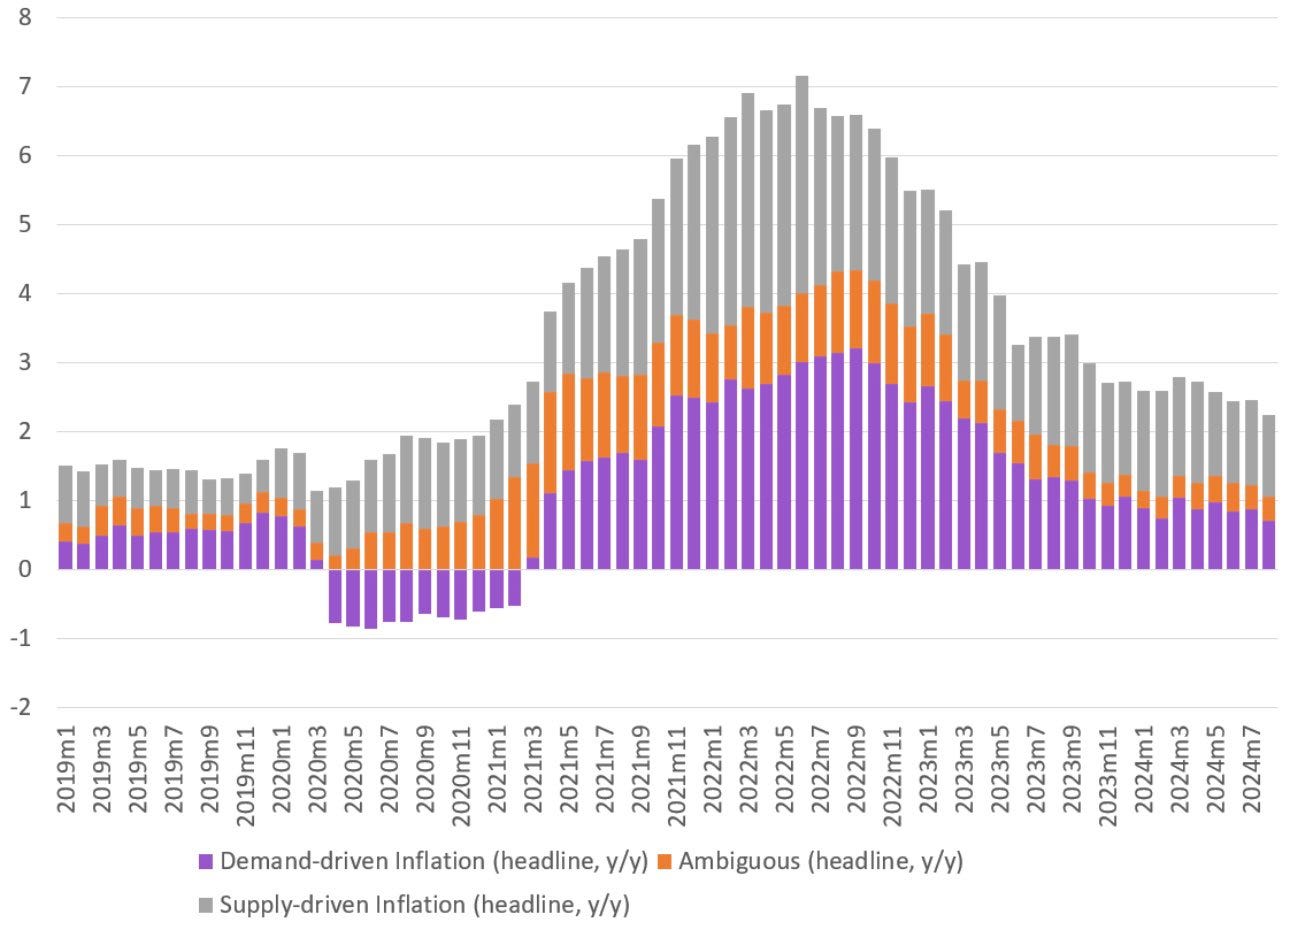
A breakdown of the contribution to inflation can be categorized into three areas: supply-side factors, demand-side factors, and ambiguous or mixed factors.
Throughout the pandemic and continuing to the present day, cost-push inflation has been the largest contributor. Supply-side issues, such as disrupted supply chains, labor shortages, and rising input costs (especially in energy and raw materials), have significantly driven up prices.
While demand-pull inflation has also played a role, it has been less significant compared to supply-side pressures. Elevated demand for certain goods and services, fueled by stimulus spending and pent-up consumer demand, contributed somewhat to inflation but did not reach the levels of supply-driven inflationary pressures.
Ambiguous factors, which can be linked to both supply and demand forces, have also had an influence, but the primary driver of inflation remains on the supply side.
It looks like re-acceleration is the current theme. The 5y5y inflation swap is trading at 249 basis points (bps), well above the Federal Reserve's expectations, signaling concerns about inflation persistence. Long-term inflation expectations appear to be pricing in stronger growth and the economy's inability to close the output gap efficiently.
Traders are now reducing their expectations for rate cuts. As of now, markets are pricing in only about 40 basis points of cuts by the end of 2024, a significant reduction from earlier expectations.
The 5y5y inflation swap is a market instrument used to measure expectations of inflation over a five-year period, starting five years from today. Essentially, it reflects the market’s view of where inflation will be in the future, specifically for the five-year period starting five years out.
For example, a 5y5y inflation swap trading at 249 basis points means that traders are pricing an average inflation rate of 2.49% per year over that future five-year period.
This measure is closely watched because it captures long-term inflation expectations and provides insight into how investors think the central bank’s policies will affect inflation over time. If the swap rate is significantly higher than the central bank's inflation target (usually around 2% in many advanced economies), it may indicate concerns that inflation will be difficult to contain over the long term.
Macro Outlook and Rates
At present, both the FRA-OIS spread and credit spreads in the U.S. are relatively low. This is a strong signal that the financial markets are not pricing in a significant crisis.
A low FRA-OIS spread suggests that banks have confidence in each other's solvency and that there is no major stress in the banking system. Banks are comfortable lending to each other at rates close to the risk-free rate, indicating that liquidity is plentiful and counterparty risk is minimal. This contrasts with times of crisis, such as the 2008 financial meltdown, when the FRA-OIS spread spiked due to fears of widespread bank failures.
Narrow credit spreads suggest that corporate credit risk is perceived as low. Investors are not demanding much additional compensation for holding corporate debt versus government bonds, indicating that default risk among U.S. corporations is not seen as a significant concern. This suggests that economic fundamentals, such as corporate earnings, balance sheet strength, and cash flow, are robust enough to support continued borrowing without heightened risk.
The current low levels of both the FRA-OIS spread and credit spreads indicate that financial markets are not pricing in a banking crisis or corporate debt crisis in the United States. Confidence remains high in both the interbank lending system and corporate credit markets.
A narrow FRA-OIS spread implies strong liquidity conditions, meaning banks have access to sufficient capital and are willing to lend at low premiums. This is important for maintaining stability, as it suggests no significant concerns about liquidity shortages or bank solvency.
Narrow credit spreads reflect confidence in the corporate sector. Investors are not anticipating a wave of defaults, and companies are able to borrow at relatively low premiums. This is consistent with an economy that, while potentially slowing down, is not yet showing signs of systemic risk or corporate distress.
The relationship between the CDX IG 5y (Credit Default Swap Index for Investment Grade bonds with a five-year maturity) and the FRA-OIS spread (the difference between the Forward Rate Agreement and the Overnight Index Swap) is crucial for understanding market perceptions of credit risk, liquidity, and overall financial stability. Here's a detailed discussion on both instruments and their interrelationship.
Both the CDX IG 5y and the FRA-OIS spread can signal market perceptions of credit risk. When liquidity is tight and banks are wary of lending to each other (indicated by a widening FRA-OIS spread), this can also raise concerns about the creditworthiness of corporate entities, which may lead to wider CDX IG 5y spreads.
In times of market stress, both spreads may rise. A spike in the FRA-OIS spread may indicate increased counterparty risk in the banking sector, while a widening CDX IG 5y spread reflects heightened concern about corporate defaults. This dual movement often signals broader financial instability.
So again no sign of widening credit spreads in the short-run. Things are relatively calm.
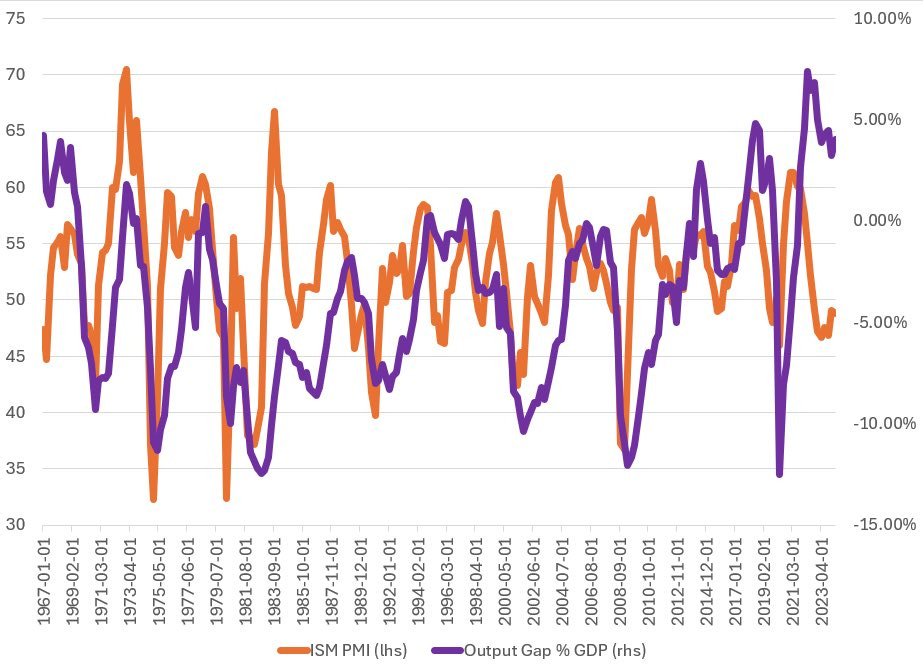
Currently, the output gap is over 5% as a percentage of GDP. Despite this, the ISM index remains relatively pessimistic. However, given the growth in the output gap, demand exceeds supply, necessitating an increase in production to meet that demand.
Historically, the ISM index tends to follow the output gap. As the output gap rises, the demand for goods and services increases, leading to higher production levels, which is reflected in the ISM index.
The divergence we are currently observing seems to stem from overall psychological pessimism. Nonetheless, on a quarter-over-quarter basis, the output gap is rising, signaling that the economy is extremely hot and showing no signs of easing. This, in turn, reflects more positive activity for the real economy, including the ISM.
Business activity tends to lead the output gap due to information advantages, and it's important to note that the ISM index has given around seven false signals of recession; this may be the eighth.
The underlying fundamentals of the economy remain robust, so relying solely on the ISM without considering other variables can lead to false signals. Given the current trajectory, I wouldn’t interpret the negative reading as a sign of impending doom.
The SOFR Z5/Z6 steepening and its implications for term premiums and inflation expectations reflect significant dynamics in the U.S. interest rate environment.
The term premium is the extra yield that investors require to hold longer-term bonds instead of rolling over short-term bonds. It compensates investors for the increased risk associated with holding bonds over a longer period, including interest rate risk and inflation risk.
When the Z5/Z6 curve steepens, it often indicates rising expectations for future interest rates or inflation. This steepening typically leads to higher term premiums, as investors demand more compensation for the perceived risks of holding longer-duration securities.
The relationship between the SOFR Z5/Z6 steepening and inflation expectations is crucial. If inflation expectations rise, investors will anticipate that the Federal Reserve may need to raise interest rates to combat inflation. This anticipation can lead to an increase in the term premium as investors seek higher yields to offset the expected decrease in purchasing power over time.
A bear steepener (base case) leading uninversion is typically viewed as a sign of improving economic conditions. As long-term rates rise due to increased term premiums associated with inflation expectations, it indicates that investors are becoming more optimistic about future economic growth. This dynamic can also influence the Federal Reserve's monetary policy decisions, as a steeper curve might reduce the likelihood of aggressive rate hikes in the short term.
The 5y5y inflation swap reflects the market’s expectations for inflation over a specific period. If investors anticipate higher inflation in the future, the fixed rate in the swap will rise, leading to an increase in the swap’s value. When inflation expectations increase, it typically results in a higher term premium as investors demand more compensation for the risks associated with holding longer-term securities. The rising term premium can cause longer-term interest rates to increase, impacting the broader yield curve.
A rise in the 5y5y inflation swap rate may indicate that investors are becoming more concerned about inflation risks, which can lead to increased demand for inflation-protected assets (like Treasury Inflation-Protected Securities, or TIPS) and higher term premiums.
Conversely, if inflation expectations stabilize or decline, the 5y5y inflation swap rate may decrease, potentially leading to lower term premiums as investors feel more secure about holding longer-duration securities.
If both inflation expectations and term premiums rise, the yield curve may steepen, indicating that long-term interest rates are rising faster than short-term rates. This steepening reflects the market's view that inflation pressures may persist, necessitating higher yields on long-term debt.
The above is what we are currently seeing.
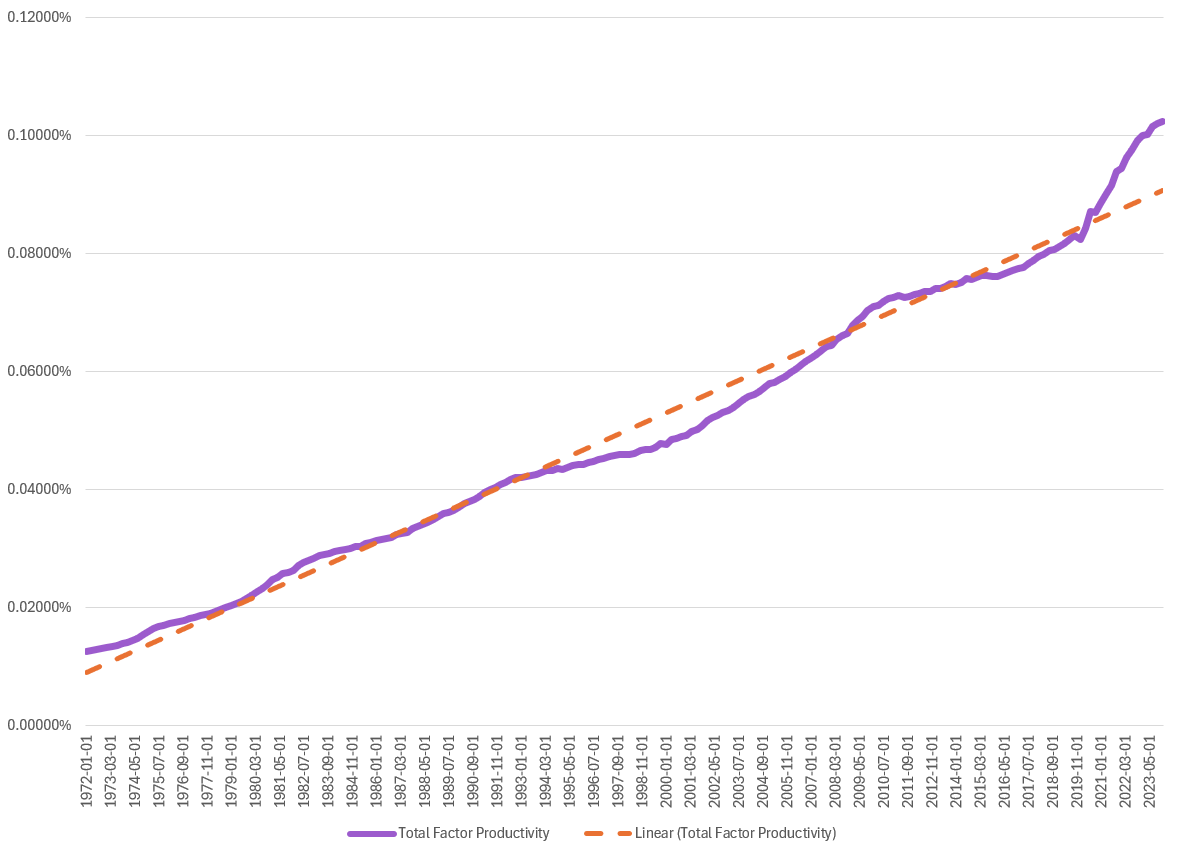
Total Factor Productivity (TFP) is a crucial concept in understanding economic growth and the capacity of an economy to enhance output. It represents the efficiency with which all inputs (labor, capital, and technology) are utilized in the production process.
TFP measures how effectively an economy combines labor and capital to produce goods and services. It reflects technological advancements, improvements in organizational efficiency, and better resource allocation.
An increase in TFP indicates that the economy can produce more output without a proportional increase in inputs. This efficiency gain leads to higher economic output, which can stimulate growth and development. Which is what we are currently seeing.
When TFP consistently increases over time, it signifies ongoing advancements in technology, better education, enhanced skills, and improved business practices. This creates a positive feedback loop where higher productivity leads to greater investments and further innovations.
TFP increases above its long-term linear trend, it can signal a period of rapid innovation or structural changes within the economy. This is currently what we are seeing as well pointing to breakthroughs in technological advancement.
A temporary spike in TFP can lead to immediate increases in output, improved profitability for firms, and enhanced living standards for workers as wages rise. Higher TFP encourages businesses to invest more in capital and technology, further enhancing productivity. As productivity rises, firms may demand more skilled labor, leading to a transformation in the labor market. This shift can create new job opportunities and require workforce retraining.
When examining U.S. economic health, companies closely tied to the real economy serve as effective barometers. FedEx and UPS are prime examples of this connection, as they play crucial roles in global trade and logistics. FedEx delivers approximately 20 million packages daily, while UPS handles around 15 million, together accounting for about 35 million packages shipped worldwide each day.
This substantial volume of shipments underscores their reliance on air cargo resources, with FedEx managing roughly 25% more air shipments than UPS. Their interdependence with global shipping highlights their importance in the logistics landscape.
Current trends indicate that EPS growth for both companies is positive on a year-over-year basis, which aligns with a slight uptick in the global world trade index. This correlation suggests that the global economy, not just the U.S., is re-accelerating, pointing towards a resurgence in the global business cycle.
In summary, the logistics capabilities of FedEx and UPS not only reflect the dynamics of global trade but also serve as indicators of broader economic health. The positive EPS growth in tandem with improvements in global trade activity suggests an optimistic outlook for economic acceleration.
When examining the earnings per share (EPS) of FedEx and UPS in relation to the Institute for Supply Management (ISM) index, the recent rebound in EPS suggests an anticipated increase in the ISM as global economic conditions improve. Despite concerns about economic health, I believe the current ISM survey may be overly pessimistic.
While it's important to note that both FedEx and UPS have not consistently beaten earnings expectations—FedEx, in particular, underperformed by about 25%—they still show positive year-over-year EPS growth despite these disappointments. This indicates that the global business cycle is beginning to turn upwards, which should lead to further EPS increases in the upcoming quarters, extending into the first half of 2025. As expectations shift, I anticipate that this will drive the ISM higher as well.
Both companies are highly sensitive to broader economic trends, including consumer spending and inventory levels. For instance, anticipated strong holiday shopping seasons could lead to higher shipping volumes, which are crucial for EPS growth.
Overall, the relationship between EPS for FedEx and UPS and the ISM suggests a positive outlook for both the companies and the broader economy, especially as we begin to see signs of recovery and growth in global trade.
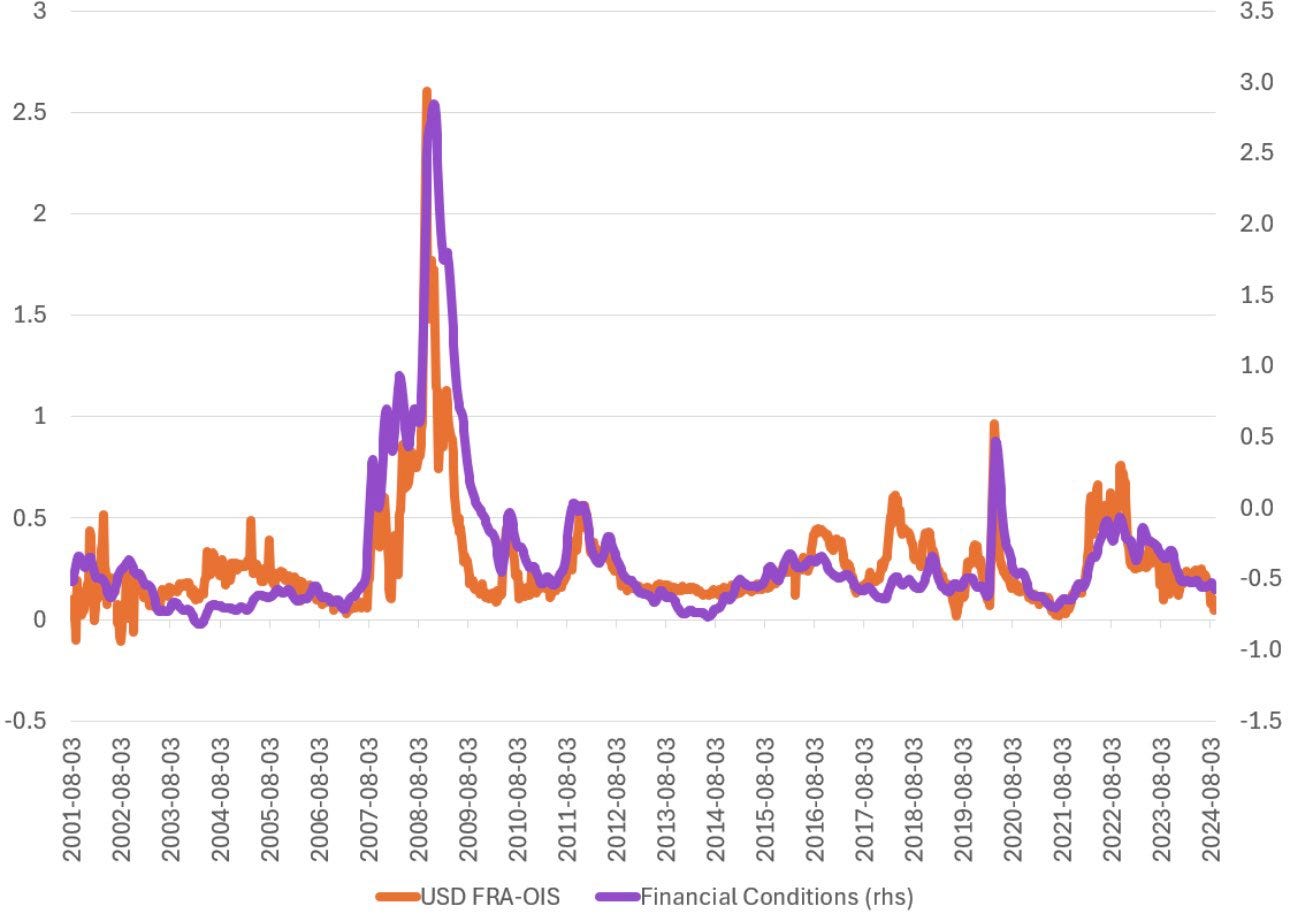
The FRA-OIS spread closely follows the movements in the FCI. When the FCI tightens (indicating deteriorating financial conditions), the FRA-OIS spread typically widens, reflecting increased credit risk and lower liquidity. Conversely, when the FCI improves (indicating easing financial conditions), the FRA-OIS spread tends to narrow.
Both indicators are influenced by market sentiment and central bank policies. For example, during periods of uncertainty or economic distress, the FRA-OIS spread often widens as banks become cautious about lending, leading to tighter financial conditions reflected in the FCI .
The relationship also serves as a predictive tool for future economic conditions. Analysts observe changes in the FRA-OIS spread as a leading indicator of shifts in the FCI, helping to gauge the potential trajectory of economic growth or recession.
Currently we remain to see both of these relatively low financial conditions are loose, and liquidity is plentiful.
Aggregate demand is poised to be robust, particularly in light of the credit impulse. By examining the credit impulse in relation to real consumption and investment (C+I) from the GDP expenditure identity, we can gain insights into private sector demand.
The components of consumption (C) and investment (I) have re-accelerated, and these two categories are the largest contributors to private sector demand. While demand is not entirely driven by credit availability, there is a clear relationship; the access to credit influences both consumption and investment levels. Recently, we have observed a re-acceleration in credit availability, which has supported higher levels of C+I.
As highlighted by analyses such as Global Macro Issues from November 19, 2008, growth in domestic demand is significantly influenced by credit access. This observation aligns with insights from Deutsche Bank regarding the credit impulse and its impact on economic activity.
In summary, the current trends in credit availability and their effects on consumption and investment suggest a strengthening aggregate demand outlook. This relationship underscores the importance of credit conditions in shaping economic growth.
When the Chicago Fed National Activity Index points to the US economy remaining resilient.
From the Chicago Fed, “A zero value for the monthly index has been associated with the national economy expanding at its historical trend (average) rate of growth; negative values with below-average growth (in standard deviation units); and positive values with above-average growth.
Periods of economic expansion have historically been associated with values of the CFNAI-MA3 above –0.70 and the CFNAI Diffusion Index above –0.35. Conversely, periods of economic contraction have historically been associated with values of the CFNAI-MA3 below –0.70 and the CFNAI Diffusion Index below –0.35.
An increasing likelihood of a period of sustained increasing inflation has historically been associated with values of the CFNAI-MA3 above +0.70 more than two years into an economic expansion. Similarly, a substantial likelihood of a period of sustained increasing inflation has historically been associated with values of the CFNAI-MA3 above +1.00 more than two years into an economic expansion.”
Currently there given this index is no sign of an impending recession and growth and economic activity still remains robust. There is no need to worry of current impending doom.
Conclusion
In conclusion, the macroeconomic outlook for the United States remains robust, with growth prospects indicating positive and continued economic expansion, both in the equity markets and the broader economy. However, a key concern is the potential re-acceleration of inflation unless current trends shift. As Keynes famously stated, "When the facts change, I change my mind. What do you do, good sir?" This suggests that adaptability is crucial in response to evolving economic conditions.
Given this context, the prevailing pessimism surrounding the U.S. economy appears overstated. While equity valuations are elevated, they do not necessarily signal impending doom or justify a short position for the remainder of the year. The rates market is reflecting expectations of growth and acceleration, further supporting the argument for a resilient macroeconomic environment.
Ultimately, the United States continues to be a prime destination for investors, showcasing strong relative returns on invested capital. This positive outlook aligns with analyses from various economic sources, reinforcing the idea that despite challenges, the fundamentals supporting U.S. growth remain solid.















Hi, thank you for your article. May I ask you how you calculate the FRA-OIS spread now that LIBOR is discontinued?
Kind regards