Uncertainty Remains Certain
Introduction
Uncertainty remains extremely elevated. We have seen asset prices across various asset classes whipsaw back and forth, leading to growing concerns about rising uncertainty. As investors try to navigate the path forward and determine where to allocate capital, the overall backdrop remains broadly uncertain. Additionally, we are now facing an increasingly complex macroeconomic environment. The key question remains: where do we go from here?
United States Equities
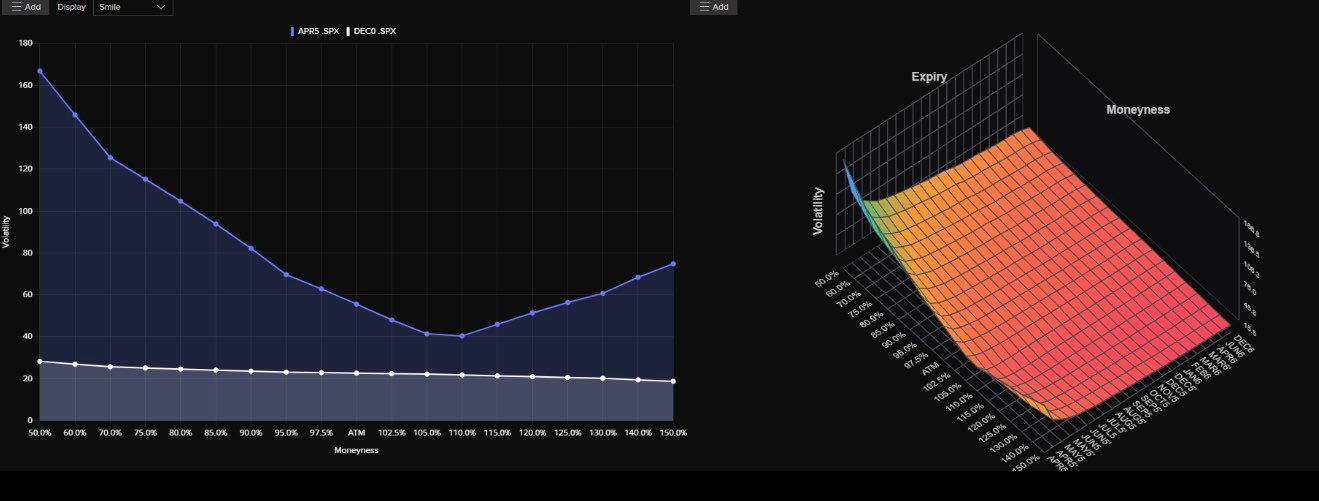
The volatility smile for SPX shows elevated implied volatility (IV) for deep out-of-the-money (OTM) puts, along with rising IV for deep OTM calls. This is driven by skew and the pricing of upside crash protection. April IV is significantly higher than December across all strikes, indicating that uncertainty remains priced into the market.
On the volatility surface, IV is highest for short-dated, deep OTM puts. IV declines for longer expirations, reflecting the classic term structure where uncertainty is front-loaded. The surface slopes downward as you move out in time towards at-the-money (ATM) strikes. Near-term downside protection is very expensive, while longer-dated options exhibit a flatter smile with less skew. A strong skew indicates that the market is pricing in significant left-tail risk in the near term.
The relationship between earnings revisions and credit spreads is relatively straight forward. When earnings revisions are positive (growth), investor confidence rises, and credit spreads narrow. Companies are seen as more stable, and investors are willing to take on corporate bond risk at lower yields.
On the flip side, when earnings revisions turn negative, it signals potential economic slowdown or worsening corporate conditions. Investors become more cautious, leading to wider credit spreads as they demand high yields to compensate for the increased risk.
The current widening we are seeing could start to put further pressure on equities.
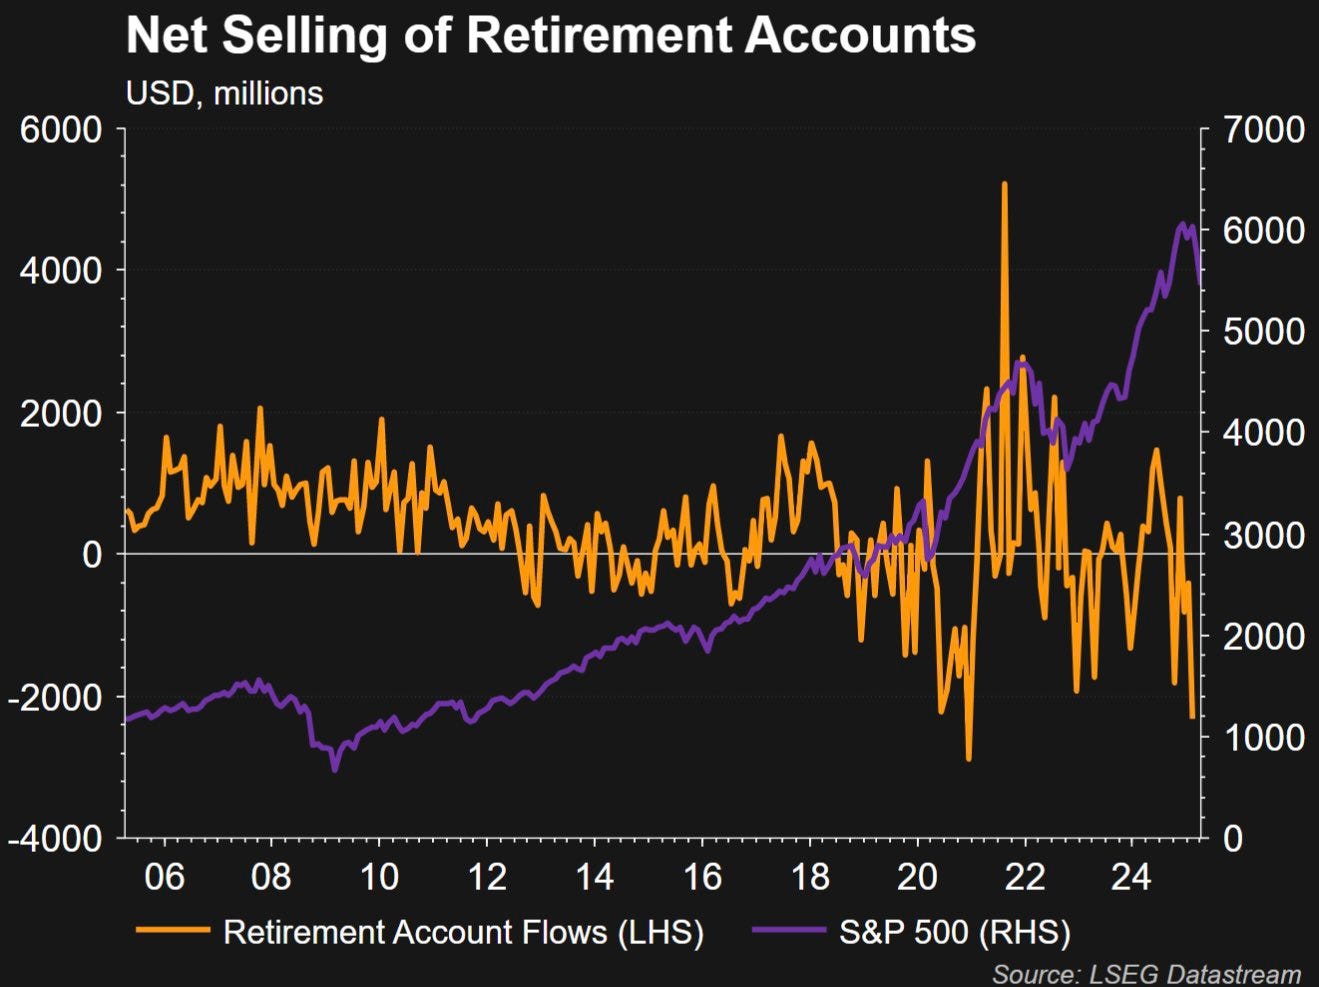
Equity drawdowns fuel S&P selling as retirees panic, triggering redemptions & exchanges out. Funds sell to meet outflows, deepening losses. Fewer new sales = less support. A self-reinforcing loop of fear. We have seen rapid selling of retirement accounts on the most recent drawdown in the S&P.
The S&P 500 traded within an 11% range on Wednesday, marking its largest intraday move since the depths of the financial crisis. This extreme volatility was driven by a rapid sequence of trade policy changes — an initial set of tariff increases was suspended just hours after being implemented, only to be replaced by an even higher tariff on Chinese imports. Alongside this, equity market volatility has continued to rise, reflecting heightened investor uncertainty and sensitivity to shifting headlines.
While I believe the United States is still the best place to allocate capital there are other markets that look attractive for allocation outside of the United States.
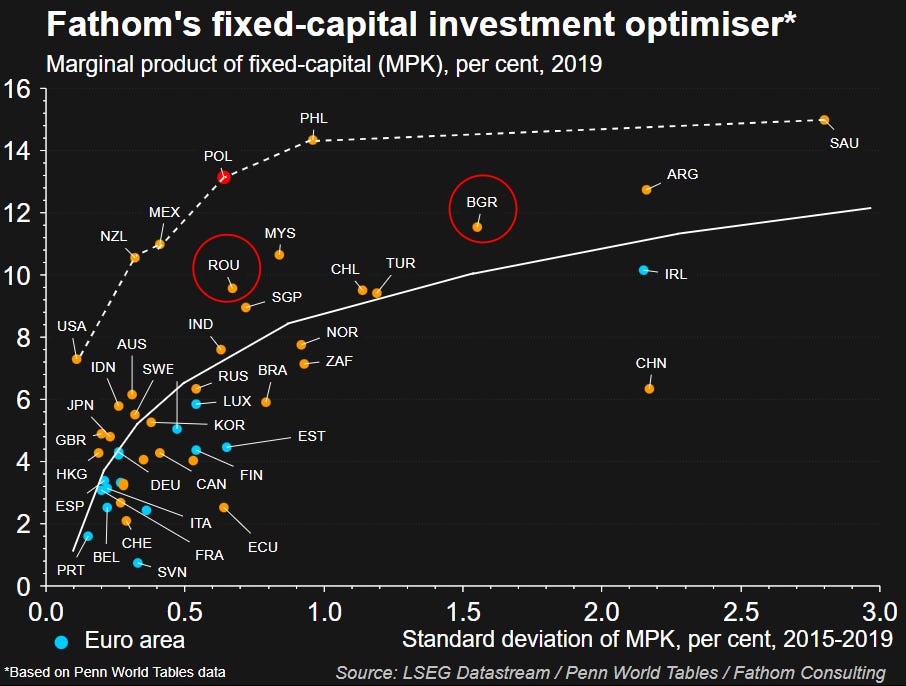
The graph below highlights the Marginal Product of Capital (MPK) this is the additional output (e.g., GDP) produced by using one more unit of capital (machinery, plants, equipment), holding everything else constant.
Fixed capital is the long-term, durable parts of capital - infrastructure, factories, and technology.
SO, the Marginal Product of Fixed Capital is the extra output produced when you increased fixed capital by one unit.
Mathematically:
MPK= δ Output/δ Fixed Capital
Below the frontier line would represent the most efficient use of capital - the production possibility frontier (PPF) or efficiency frontier for capital.
If a country’s MPK is on the frontier line it means it’s using capital very efficiently. Any increase in capital yields the maximum possible output relative to other countries or economic conditions. There’s no waste or underutilization of capital. If a country has an MPK on the frontier investors could expect their money to yield better.
You are also going to see efficient use of resources, which would suggest good institutions, infrastructure, and policies. Lower risk of inefficiency, capital won’t sit idle or be mismanaged.
Based on the frontier Poland, Mexico, and New Zealand remain relatively attractive.
Global Trade and Tariffs:
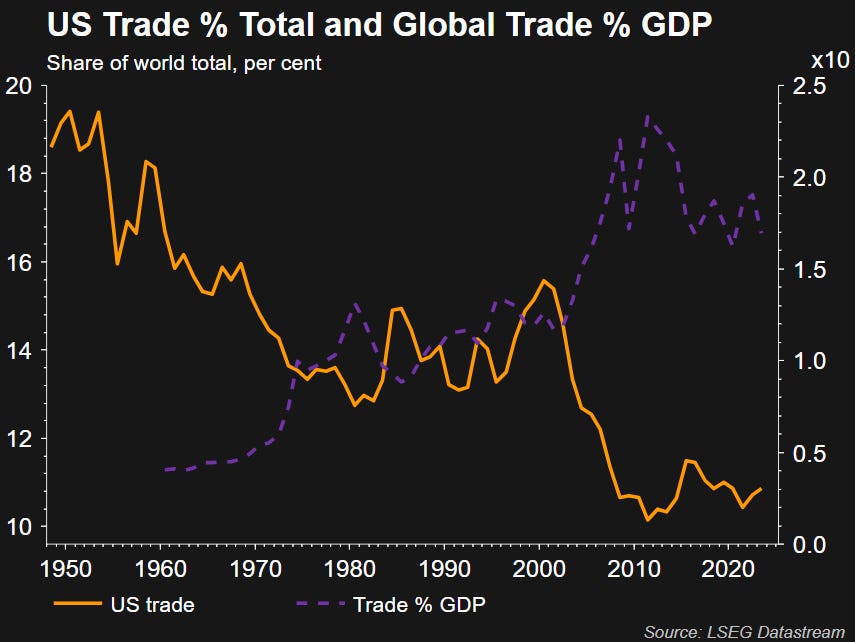
The overall trade war during 2018 led to the US share of global trade dropping by about 2.5%. Given the current trade environment, this trend is likely to worsen, potentially causing the US share of global trade to fall even further.
We also saw similar policies in the past lead to disruptions in global trade, with world trade as a percentage of GDP falling sharply during the initial period of trade tensions before eventually returning to more normal levels.
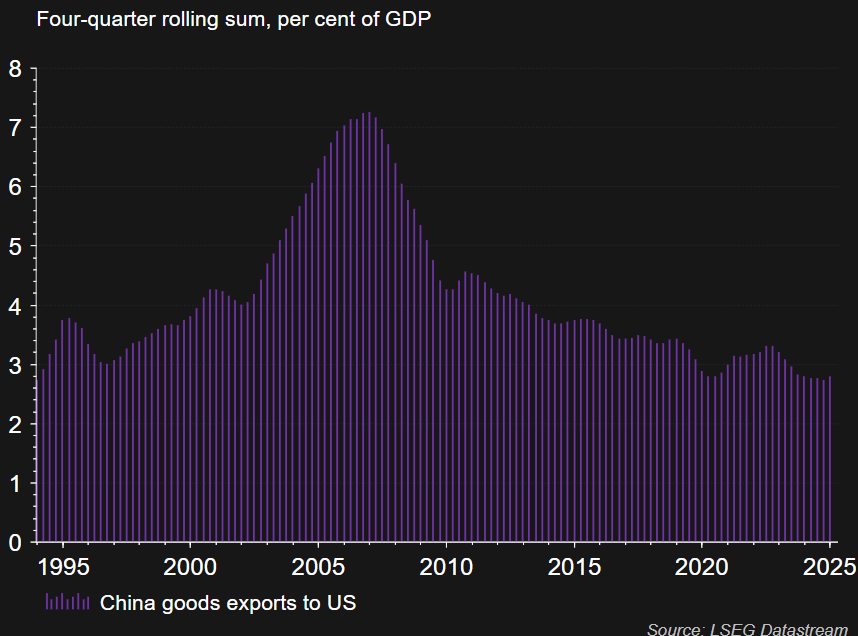
While trade wars are generally harmful, it’s important to note that the value of goods China exports to the United States represents a significant portion of China’s GDP — with exports to the US alone accounting for roughly 3% of GDP, as shown below. This highlights how challenging it would be for China to shift away from the US as a key buyer.
Trade tensions, tariffs, and talk of decoupling have dominated headlines in recent years. But how exactly do tariffs affect the US trade balance? To answer that, let’s take a look at the current state of US trade with some of its biggest partners.
This chart breaks down US trade with Germany, the Euro Area, China, Japan, Canada, and Mexico. Each bar shows the flow of goods and services between the US and these regions:
Orange = US Services Exports (sold to them)
Blue = US Services Imports (bought from them)
Green = US Goods Exports (sold to them)
Purple = US Goods Imports (bought from them)
Red Dot = US Trade Balance (Exports - Imports)
Most noticeably:
China → The US imports far more from China than it exports, leading to a trade deficit of nearly $400 billion.
Euro Area → Another major deficit of about $600 billion.
Mexico & Canada → Despite integrated supply chains, the US still runs deficits with both.
Ultimately, the US trade balance is shaped by much more than just tariffs — including consumer demand, global supply chains, and structural economic factors.
So while tariffs might move the needle in the short run, lasting change in the trade balance would likely require broader shifts in production, consumption, and investment patterns.
The sporadic rollout of tariffs has created significant uncertainty across global markets. While the latest round of tariffs has been delayed for another 90 days, this temporary reprieve has done little to ease concerns. Instead, it has simply deferred the risk of renewed uncertainty, with many market participants worried that these same issues will resurface in three months’ time.
Rates
As tensions between the U.S. and China periodically flare up, one threat that occasionally resurfaces is the idea of China reducing its holdings of U.S. Treasury bonds. Given that China remains one of the largest foreign holders of U.S. government debt, this naturally raises an important question:
If China sells Treasuries, could that push U.S. yields higher?
The U.S. Treasury market operates like any other market — prices are driven by supply and demand.
If demand for Treasuries rises → Prices go up → Yields (interest rates) go down.
If demand for Treasuries falls (or supply rises sharply) → Prices go down → Yields go up.
China selling a large chunk of its Treasury holdings essentially increases the supply of bonds in the market. More bonds for sale, all else equal, should lower prices — which means yields would have to rise to attract new buyers.
While China selling U.S. Treasuries could lead to higher yields in the short term — and I believe this is what we have seen recently — over the long run, new buyers are likely to step in, helping to stabilize the overall Treasury market.
Looking at the United States, we are currently seeing one-year inflation swaps pricing in inflation around 3%. This is likely being driven by concerns over the short-term implications of tariffs. However, when looking at the policy rate implied by market pricing, there is little indication of significant easing expected. Despite the recent volatility, the most probable outcome remains a 76.1% chance of the Federal Reserve holding rates steady.
In my view, the Fed’s reaction function in this environment is to closely follow market pricing. The last thing the Fed wants during a period of heightened uncertainty is to deliver a surprise that could further destabilize markets. I believe the Fed will stay the course, providing clear guidance to help anchor expectations and maintain stability.
Markets right now are grappling with a lot — tariffs, inflation worries, Fed policy, and geopolitics — and nowhere is that tension more evident than in the U.S. Treasury market. The chart above provides a fascinating look at current U.S. Treasury yields across different securities, including traditional government bonds (US Govies), TIPS (inflation-protected securities), and various stripped securities like IO and PO STRIPS.
The most striking aspect is the steep upward slope of shorter-term yields before the curve begins to flatten out and even drift slightly lower at the long end. This shape tells a story: investors are demanding higher compensation for holding short-term risk, likely reflecting near-term uncertainty — including inflation risk and tariff-driven volatility.
TIPS (shown in red) are trading at dramatically lower yields relative to nominal Treasuries. This reflects strong demand for inflation protection. Despite forward inflation swaps suggesting inflation is well-contained over the long run, the front-end demand for TIPS shows that investors are still very much concerned about near-term price pressures.
Behavior of IO (Interest Only) and PO (Principal Only) STRIPS (in cyan and magenta). These securities show higher yields relative to their traditional counterparts. This could be a signal of liquidity stress or forced selling — possibly related to China’s rumored trimming of its Treasury holdings. STRIPS tend to be less liquid, and rising yields here could indicate supply hitting the market without sufficient demand to absorb it — at least initially.
Markets are in a delicate balancing act. Short-term risks — tariffs, inflation, China selling Treasuries — are pushing yields higher in the front end. But long-term yields remain anchored, a sign that buyers still have faith in U.S. policy credibility and the Fed’s ability to manage through volatility.
Another key dynamic that cannot be overlooked in this environment is the sharp rise in volatility, particularly in short-term interest rates. We've seen a significant move higher in short-rate volatility, most notably driven by growing demand for receiver swaptions. This demand reflects increasing investor concern that the previously optimistic economic outlook may be deteriorating.
Looking at market pricing, the probability of extreme tail-risk scenarios has risen once again. The cost of protection against sharp downside moves in swap rates — especially through options — has increased meaningfully. This signals that investors are positioning for a wider range of potential outcomes.
Notably, a sharp fall in swap rates would most likely require a substantial drop in the Fed Funds rate. However, it’s important to highlight that few, if any, are currently forecasting a rapid or aggressive cutting cycle from the Fed.
What we’re seeing, particularly in the options market, is concern about economic slowing — but not an outright recession severe enough to trigger emergency rate cuts. If we look at the implied probabilities of rate cuts embedded in Fed Funds futures, the market seems to agree: a moderation in growth, not a collapse.
Given the increased demand for near-term protection, the price of implied volatility has moved higher. The greater the uncertainty over a given period, the more expensive protection becomes.
This is evident when looking at the implied volatility on, for example, a 3-month option on a 2-year swap, which has risen sharply. None of this is surprising given the multitude of exogenous risks currently facing the market — from geopolitics to global trade tensions to policy uncertainty.
Conclusion
In conclusion uncertainty remains certain. We should continue to see very rapid swings in asset prices until we have a normalization of policy. Equities should probably start to find some footing here soon. Could continue to see some sell-off in yields but nothing drastic. All in all I think volatility remains.





Do FX rates impact your analysis? For example the purchasing power parity of the Yuan is around 3.25. The probably wouldn’t be any call for tariffs if I traded at this level.