

The Economic Outlook is Grim and Uncertainty is Elevated

Everyone continues to talk about rate hikes and the need for the Fed to be able to destroy demand. We are already seeing demand destruction, and we are seeing a terrible future outlook for economic growth. This is a grim situation as it could lead to a situation in which we have lower economic output. We are not just seeing this within the US, but this is a global slowing of economic growth and outlooks for world trade. We are seeing world trade slow rapidly, deteriorating CAPEX expectations, slowing private investment, slowing freights, unwillingness to grow commercial and industrial loans, and finally what this all means for future productive capacity. This article will focus mostly on the US, but we will also take a look at some global factors that we are seeing. The first thing we will look at is the slowing of world trade.
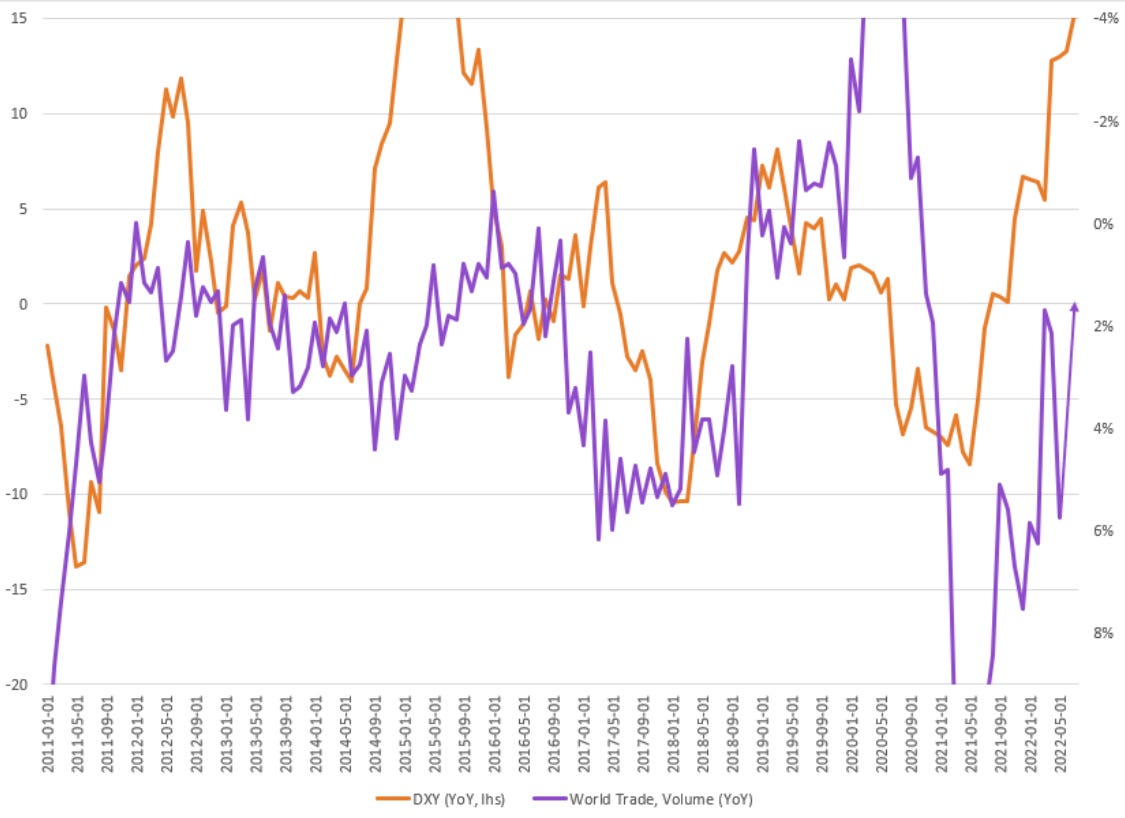
The first thing that must be discussed is world trade, as we have moved towards a more globalized economy there is a lot of interconnection between the US, and other nations. However, what we have begun to see is a slowing of world trade. World trade usually slows on the back of a stronger dollar. As the dollar strengthens this puts downward pressure on world trade, and this could firstly be due to rising commodity input costs (usually denominated in dollars), and two terms of trade effects. So as the dollar strengthens there will be less demand for goods and services that are priced in dollars whether that be commodities or other things produced. Second, we have to look at terms of trade effects which is the depreciation of a nation's exports relative to imports. As the dollar strengthens exports increase relative to other nations' imports, and this puts again downward pressure on world trade. This can be seen in chart 1. below.
The next thing we are starting to see is the shift in CAPEX, and we are starting to see drawdowns within the CEO CAPEX (sub-index). This leaves us at a point where if we are seeing deteriorating CAPEX once we come out of a recession (if you believe we are in one) growth will be much slower. Why does this happen? Well think of CAPEX as an investment in things that produce output, so one should think about CAPEX as an investment in physical assets such as plants, equipment, and machinery. We have also seen Commercial and Industrial loan standards become tighter. This means less excess to business loans and loans that could produce and raise output. This can be seen in chart 2. below.

Continuing with commercial and industrial loans, and the growth within this side of the loan book I believe is important. In chart 3. which is posted below you can see the percentage of C&I loans relative to all loans and leases issued by banks. What can be seen in chart 3. is that C&I loans have more or less been on a steady decline from roughly 35% of all loans to roughly 24% of all loans. This has an important implication, and that is banks are issuing loans more or less that subsidize consumption more so than loans that will increase productive capacity.

The next case and point are looking at the ISM and Cass Shipment data. In chart 4. one can see the two things are correlated while the shipment data does tend to be more volatile than the ISM. What one could deduce from this is that the economy is slowing, while the ISM and Cass index isn't in a contractionary territory (yet) they are slowing. Looking at these two indexes side by side can be used as an indicator to follow how the economy is flowing, and a drawdown in the Cass index could be a way to help forecast shipment prices into the future. Within the chart below it is important to know that ISM leads by about 2 months, so with that being said, there is more slowing to come to the shipment index.

The chart 5. below depicts capacity utilization (CU) against the ISM. The two have more or less moved in lockstep over the years. The reason this is important is that as ISM has started to fall (leading indicator) so should CU if the historic correlation holds. This is both good, and bad. The good side of falling CU is it is a sign of demand destruction which means usually a lower demand for goods, which means the price level will fall to find a new equilibrium between quantity supplied and what is being demanded by the market. The second part is that this means that there will start to be a rise in unemployment which is bad. Lower demand means less need for workers. This very simply is because the machines are fixed resources, and what that is to say is whether you produce 1 unit or 100 units you still need that equipment to produce any quantity of units. Employees are variable resources so as the quantity of units that needs to be produced changes so will the number of workers you need to help try to produce the final output. You could say that it is because there will be changes in the production function, and let us say in the sense that the output needed relative to inputs will change, as the demand for goods and services changes. So we can see that is bad, however, it is bad if it persists. The most positive part though again assuming the correlation holds is that we should see a decrease in prices.

The Federal Bank of NY on the newest update on their DSGE model (dynamic stochastic general equilibrium model) is showing that macroeconomic variables are shifting, and as such we are seeing more downside in the outlook of the model. Looking two years forward GDP as a sum will be less than GDP at present, our deviation from the trend in terms of real GDP growth will be further exacerbated. This is included below in chart 6.

Looking at leading economic indicators specifically the Conference Board leading economic indicator (LEI) it is not yet in contractionary territory, as of this writing, it is roughly 140bps away from being in contraction. The index currently sits at 139bps points anything below zero would be contractionary. However, looking at the index the rate of change in which it is drawing down is showing signs that things are deteriorating at a rapid pace. This is a good way to get a glimpse into what we are seeing ahead and has usually led economic growth by about 2 quarters. If this correlation holds it is showing that the business cycle is turning and that we could see a further slowing of economic growth ahead. The graph is depicted below in chart 7.

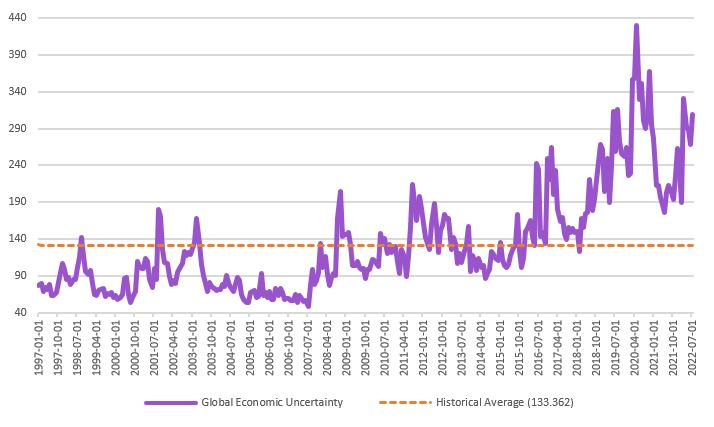
In the global outlook, we are seeing extremely elevated levels of economic uncertainty. Looking at the economic uncertainty index in chart 8. it is well elevated above its historic trend. This is a function of many things recessionary fears, war, food, supply chains, and monetary policy uncertainty. This can put a tremendous amount of pressure on different aspects whether it be outflows from domestic currencies into US Dollar or increased hedging. The high elevated levels of economic uncertainty are not painting the picture that on a global scale everything is fine and dandy.
Following up on the uncertainty the chart below in chart 9. shows how this can lead to a demand for one currency relative to another this can be measured by the cross-currency basis swap. Economic uncertainty within Europe (EU) is on the rise again, and this has created conditions in which investors' appetite to hold anything in the EU especially Euro has started to deteriorate. We have thus seen a rise in demand for dollars, and as liquidity has tightened the basis has become more negative. This I stated is a function of a high level of uncertainty, and the unwillingness to take a bet on the EU getting their economic issues (which there are many) under control. Again pushing the uncertainty within Europe up and pushing the cross-currency basis swap more negative.

Another measure to gauge economic uncertainty is where forward differentials are, so below in chart 10. this was done by looking at the difference between EUR12X18F - USD12X18F. Now while this relationship and correlation haven't always been perfect in terms of gauging economic uncertainty broadly speaking when economic uncertainty is low it coincides with EUR forward differentials being higher than similar USD differentials, and vice versa. When forward rate differentials are higher within Europe it will keep all things equal money within Europe. However, as that changes you will see those different economic policies whether it be monetary or otherwise coincides with the USD differential being more attractive than EUR. The current regime for this is first being more faith in Federal Reserve to tackle inflation, as opposed to ECB and more attractive rates, and second as stated above just worse conditions in the EU. As such we have seen the USD relative to EUR pick up strength and the spread become more negative (favoring USD). This has happened again on an uptick within uncertainty in the EU.

In the words of Milton Friedman, "I am in favor of cutting taxes under any circumstances and for any excuse, for any reason, whenever it's possible." Overtime the manufacturing base has been absolutely destroyed, and we have seen years of underinvestment within manufacturing and industrial industries. We have see no shift to increase productive capacity, and this has led to massive issues when we went through pandemic, as the aggregate supply curve shifted more left and became more inelastic everyone in the world was caught off guard. This was due to the financialization of the economy, and on the back of subsidizing consumption. What we need to do is offer tax incentives that grow output (why I brought up Friedman).
The graph below offers another shocking trend output per hour (productivity) is the lowest that it has been since the 1960s, and unit labor costs are some of the highest since the 1980s. This should be extremely telling about the current state of our economy, and that no matter as much as we hear it the economy isn't healthy. We have taken on subsidization of consumption (demand side) and completely neglected the supply side, and the repercussions of this have started to rear its head with the higher price levels we are seeing. This can be seen in Chart 11 below.

Finally wrapping this all up by looking at the global supply chain pressures. Global supply chain pressures are starting to ease, but at the same time, we are having an easing within manufacturing capacity utilization. This means that less of the factor is being utilized to its full level of output. This is due to falling demand, and that demand can be seen in falling ISM New Orders data. This is a sign that we will see a collapse in global supply chain pressures that have led to elevated levels of CPI. It is also an indication that demand destruction is already underway. We no longer have demand-pull inflation, and this will help elevate some of those GSCPI pressures that we saw. If you look at chart 12. you can see where there was the first spike in GSCPI. This is due to the massive demand pull on the back of capacity utilization contracting. So as all of these start to ease, and as pointed out earlier in the article as shipments and world trade ease. Supply pressures will start to ease, and due to recessionary fears which I think there are many, we will see demand destruction. The ability to have supply shift back to the right and demand shift back to the left due to a recessionary gap we will see a lower price level coming out of this. However, like I said this also probably points to much lower growth in the short run.

In conclusion, there are a lot of things going on within the economy. Using all of the indicators combined help to shed some light on what is going on, this is a conversation that could take up much more space. However, I think from where I have left things it paints a pretty decent outlook of where we are in terms of the business cycle. We are seeing all sorts of factors that are going to lead to much lower growth and output. We are seeing much uncertainty within the global economy, and hopefully, this article helps highlight some of that. With that being said understanding the macroeconomic backdrop has never been more important.