Macro Brief

Introduction
In this brief, a broad range of topics will be examined spanning macroeconomics, equities, credit, rates, and foreign exchange. The overarching thesis remains that the global macroeconomic backdrop continues to demonstrate resilience, supported by steady growth and anchored inflation expectations, even as several key indicators point toward gradual normalization. While certain sectors and markets are transitioning from the post-pandemic momentum phase toward a more balanced equilibrium, the underlying fundamentals suggest that the expansion remains intact. This report aims to contextualize recent developments across major asset classes within that broader framework, highlighting both cyclical adjustments and structural trends shaping the current investment landscape.
Macro
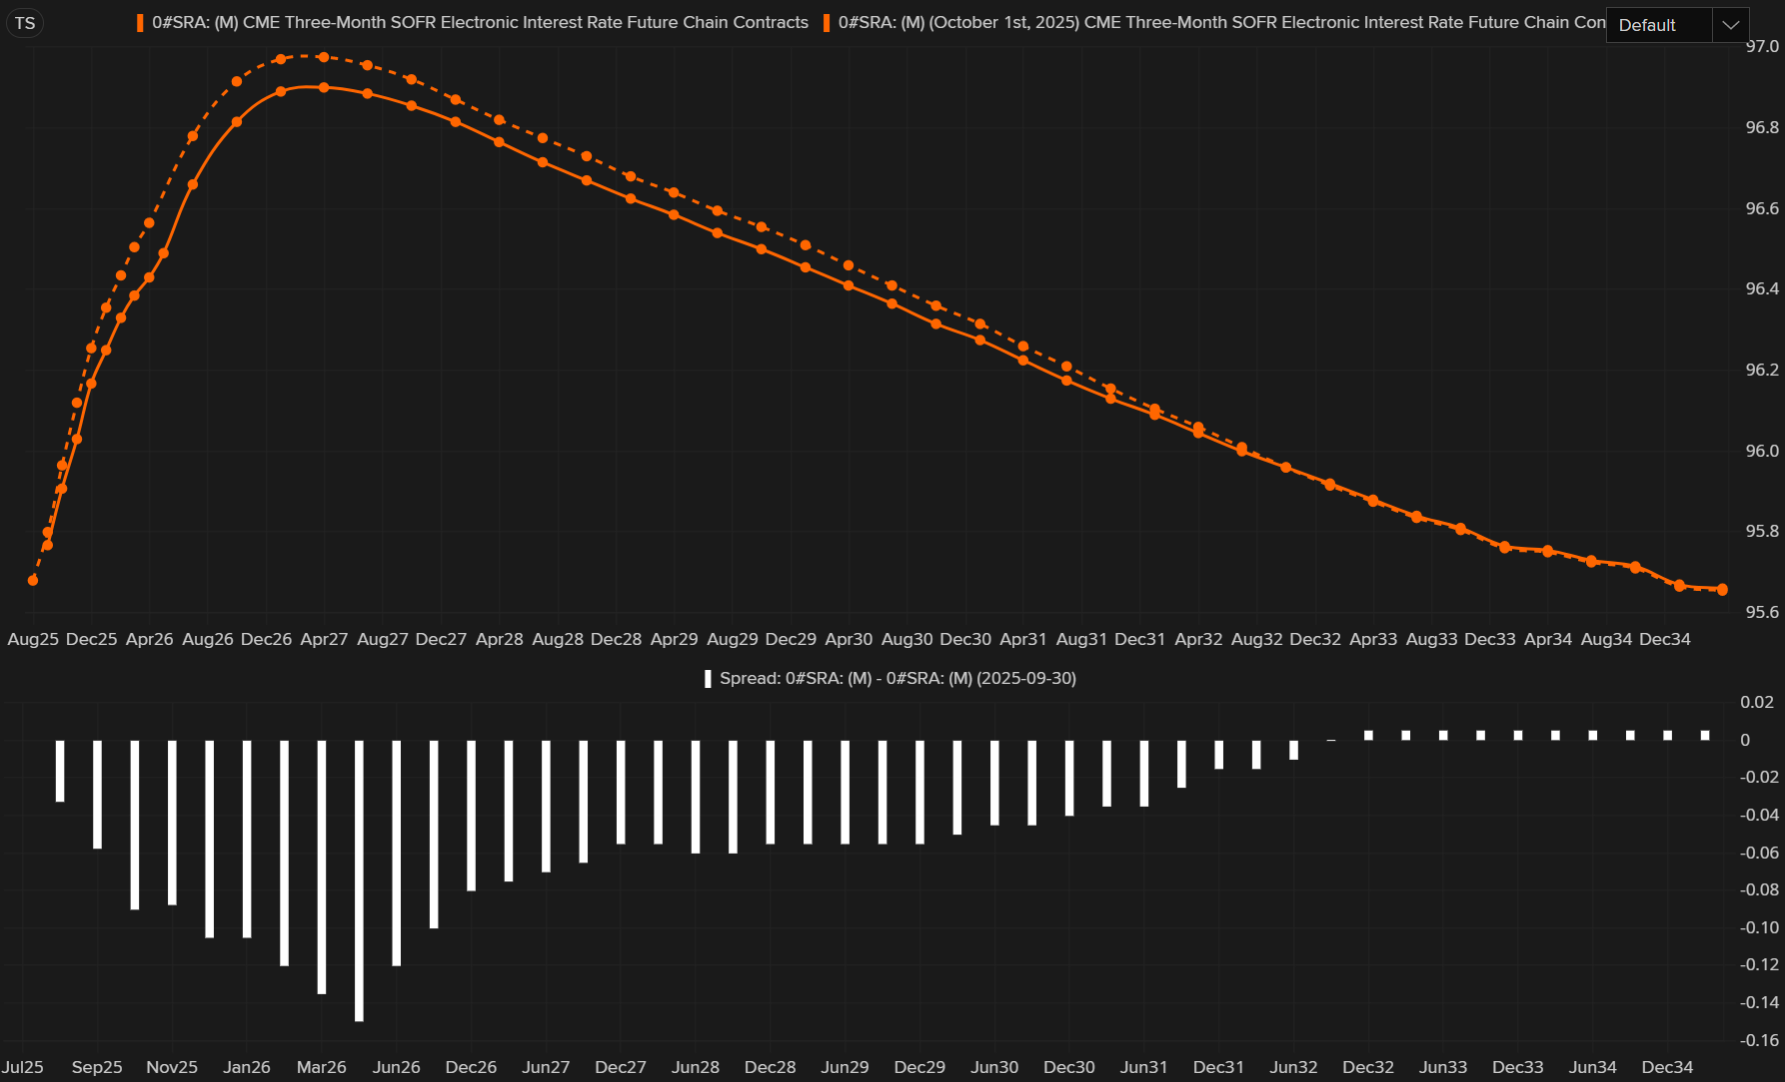
We learned that the Fed will end Quantitative Tightening beginning on December 1st. They also announced that all principal payments from MBS will be reinvested into Treasury bills. The overall impact on the front end of the curve appears relatively small, with total compression of approximately 8 basis points.

Under the income approach, Real GDP is derived by summing all forms of income generated in the production of goods and services within the economy. Conceptually, it measures GDP from the returns to factors of production that is, how much households and firms earn rather than how much they spend or how much output is produced.
In this analysis, the 0.25% month-over-month increase in real GDP via the income approach primarily reflects moderate gains in wage and salary disbursements and proprietors’ income, partially offset by a mild contraction in corporate profits and net interest income. Taxes on production and imports provided a small positive contribution, while rental income and depreciation remained broadly stable.
When annualized, this growth trajectory aligns closely with a 3.5% real GDP expansion in Q3, suggesting that despite some moderation in monthly income growth, the underlying pace of economic activity remains robust. The income approach continues to signal a resilient labor market and steady profit generation, both consistent with a soft-landing narrative rather than a contractionary phase.

The chart above illustrates Real GDP as measured by the income approach, benchmarked against a Holt–Winters monthly estimate that interpolates quarterly data to produce a higher-frequency series. The income approach calculates GDP by summing all forms of income generated through production primarily wages, corporate profits, rental income, net interest, and taxes less subsidies.
When expressed in nominal dollar terms, the trajectory highlights the long-run expansion of the U.S. economy, punctuated by brief periods of contraction during recessions. The Holt–Winters estimate (orange) smooths and interpolates between quarterly observations to provide a more continuous view of monthly income-driven GDP dynamics. This technique captures short-term fluctuations while maintaining the long-run trend consistency of realized quarterly GDP (purple).
Overall, the nominal income-based GDP series continues to show resilience, with only brief interruptions during major downturns. The close alignment between the realized and estimated series indicates that income-based GDP remains a stable and reliable measure of underlying economic activity, reinforcing the robustness of the 3.5% annualized growth outlook heading into Q3.

GDP growth is essentially a tug-of-war between capital deepening, labor, and productivity.
Since the 2000s, capital and total factor productivity (TFP) have done most of the heavy lifting, while labor has generally contributed less. This dynamic has shifted in recent years, with both labor and capital now driving a larger share of growth.
If capital per worker continues to rise y=f(k) and capital remains the primary growth driver over the long run, the steady state level of output shifts upward. In other words, greater capital accumulation translates to a higher level of potential GDP.
It is important to note, however, that there are diminishing marginal returns to capital. Over time, each additional unit of capital adds less to output. That said, technological progress (TFP) continuously pushes the production frontier outward, allowing the steady state to rise even as the returns to capital diminish.

The Federal Reserve cut rates into what remains a broadly robust economy. Historically, the Fed has reduced rates while the output gap was positive only about 22.6% of the time, and even in those instances, the magnitude of the gap rarely exceeded +1% to +2% of GDP. Typically, when policy easing occurs during a positive output gap, the economy is only marginally above potential closer to equilibrium than to overheating. This historical context suggests that the recent rate cut lacks strong precedent, with limited empirical justification in the underlying data to warrant such an accommodative move.

This chart shows that 40% of imputations rely on different cell imputations.
For example, if coffee prices are unavailable from all sources in South Carolina (the home cell), the BLS uses alternative cell imputations (as shown below the chart). This approach preserves the item category but broadens the geographic scope to fill the gap.
In essence, the metric represents the share of cells requiring imputation, with the denominator being the total number of cells that need to be imputed.

The balance of power between monetary and fiscal authorities is shifting.
Traditionally, in a Ricardian regime, central banks are active and fiscal authorities are passive. Monetary policy anchors the price level, while governments adjust spending or taxes to ensure debt sustainability. Inflation behaves as predicted by the Quantity Theory of Money, and the real value of debt is stabilized by expected future primary surpluses.
In contrast, under a non-Ricardian regime, fiscal policy dominates. When the government fails to generate sufficient future surpluses, the price level must adjust so that the real value of outstanding debt equals the present value of those surpluses. This is the core of the Fiscal Theory of the Price Level (FTPL) — inflation becomes the adjustment mechanism that restores fiscal solvency. In such a setting, central banks are effectively constrained or passive.
We employ Threshold Vector Autoregression (TVAR) models to detect these regime shifts. TVAR allows the dynamic relationships between inflation, interest rates, and fiscal variables to change once a key threshold — such as debt-to-GDP — is crossed. For example, as debt rises, inflation may respond more to fiscal shocks than to monetary policy, signaling an underlying transition toward fiscal dominance.
While the U.S. likely remains in a Ricardian regime today, the trajectory suggests a gradual move toward fiscal dominance. Rising debt levels, political resistance to fiscal consolidation, and growing fiscal pressures on central banks all point in that direction. In such an environment, inflation may increasingly reflect fiscal imbalances rather than purely monetary conditions.

The savings rate of capital the share of profits or cash flows that firms retain rather than reinvest or distribute tends to be cyclical. Historically, it rises ahead of and peaks during recessions, then declines as recovery takes hold.
When recession fears increase, firms become more cautious. They accumulate liquid assets, delay capital expenditures, and prioritize balance sheet repair. This behavior pushes the savings rate of capital higher, as retained earnings are conserved to weather potential demand shocks or credit tightening. In macro terms, this corresponds to a period of capital preservation low investment, rising precautionary balances, and falling marginal efficiency of capital.
As recession risks subside, confidence and risk appetite return. Firms begin to draw down savings and increase the consumption of capital deploying cash reserves toward capex, share buybacks, or acquisitions. This phase marks a shift toward capital utilization, as the opportunity cost of holding idle balances rises in a stronger demand environment.
Eventually, as the business cycle matures, profit margins compress and financing costs increase. Firms once again tilt toward saving rather than deploying capital, signaling that the cycle is turning. This dynamic often precedes a downturn, as higher savings and lower investment indicate growing caution and tighter financial conditions.

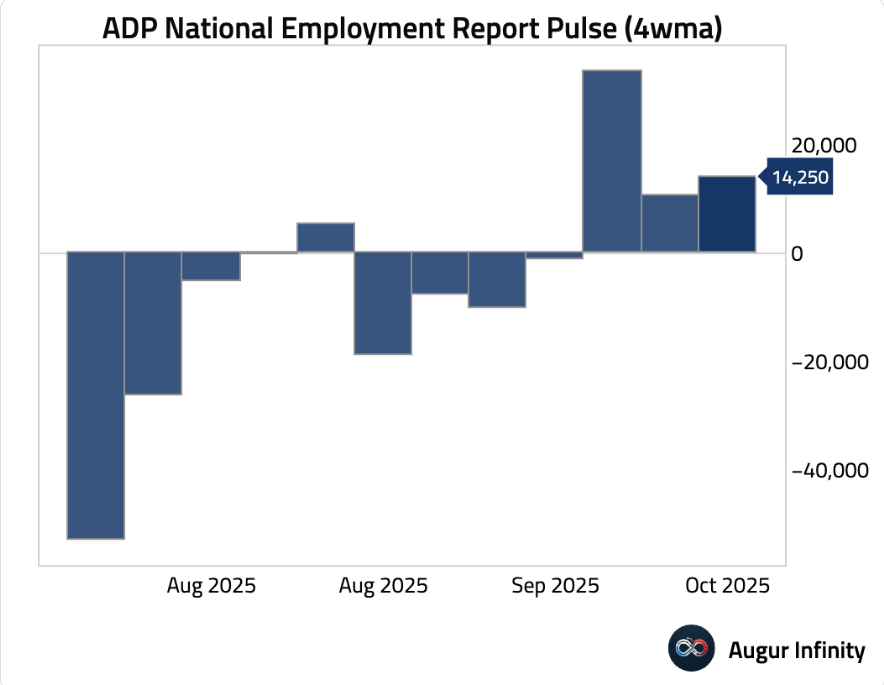
ADP released their National Employment Report today, for the four weeks ending Oct. 11, 2025, the NER pulse shows that private employers added an average of 14,250 jobs per week.
Equities
Below is the mix of EPS and revenue beats reported so far for Q3 2025. At a high level, there are no signs of broad-based deterioration in earnings or revenue, which should be a positive signal for equity markets.
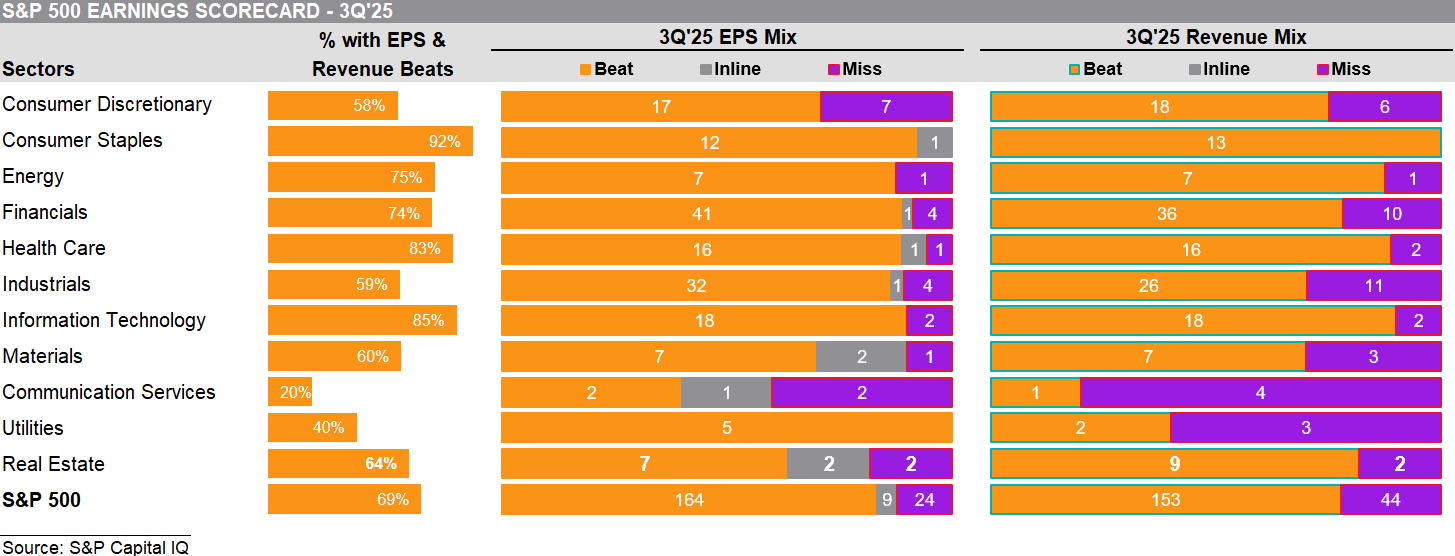
It’s hard to identify meaningful headwinds to S&P 500 earnings growth at this stage. The vast majority of companies within the index continue to generate economic profit where marginal revenue exceeds marginal cost suggesting that production remains highly efficient. In aggregate, each additional unit of output produced by S&P firms is adding more to total revenue than to total cost, reinforcing both margin stability and the underlying momentum in earnings growth.

Historically, the primary drivers of earnings-per-share (EPS) growth have been sales expansion and profit margin improvement. When companies are able to grow revenues while maintaining or widening margins, EPS tends to rise even without major changes in share count. At present, both sales and margins across the S&P 500 remain relatively stable, with no signs of broad-based deterioration. Unless we see a significant contraction in either top-line growth or operating margins, it’s difficult to identify major headwinds to continued EPS growth.

Small-cap NTM EPS growth is once again strengthening relative to the S&P 500. Forward earnings are beginning to reflect this trend, with relative growth expectations for small caps improving once again.

Claim dilution is falling — when capital grows faster than debt, profits stabilize and inflationary pressure eases.
With less balance sheet strain, residual profits and EPS are likely to rise as equity growth outpaces debt service costs. When equity expands faster than leverage, firms experience less drag from rising interest expenses, preserving margins and supporting earnings growth.
Because excess claims are no longer pushing demand beyond capacity, inflationary pressures diminish, reducing the risk of margin erosion from higher input costs.
This healthier balance between capital and debt promotes more sustainable, equity-driven growth, in contrast to debt-fueled, inflationary booms that tend to fade quickly.

The spread between ROIC and WACC remains high by historical standards. This indicates continued value creation across the corporate sector, suggesting that despite concerns about valuation multiples, equities are likely to remain supported and continue attracting investor demand.

Buybacks have traditionally been debt-financed; however, this relationship has recently broken down.
Historically, companies tended to increase share repurchases when debt was cheap—typically during periods of expanding profit margins—because the added leverage appeared manageable. In those environments, borrowing to fund buybacks was viewed as an efficient way to enhance EPS and return capital to shareholders.
More recently, however, the data suggest that debt issuance is being directed less toward financial engineering and more toward capital expansion. Firms appear to be allocating a greater share of borrowed funds to capital expenditures (CapEx) and strategic investment, rather than buybacks, signaling a potential shift toward growth-oriented balance sheet deployment.

Equity returns during steepening regimes show an interesting pattern — bear steepening tends to be bullish for equities.
While bull steepening often acts as a drag on equity performance, bear steepening typically coincides with stronger equity returns.
In the current environment, improving corporate earnings and a more optimistic macro outlook suggest that equities could continue to trend higher, even as the yield curve steepens.

Base case continues to be bear steepening this has traditionally boded well for corporate profits. Expecting decent profit growth for remainder of 2025.

Despite the market pricing in roughly 100 basis points of rate cuts over the next 12 months, homebuilders are underperforming.
Typically, rate cuts would support the relative performance of homebuilder stocks versus the broader S&P 500, as lower financing costs tend to stimulate housing demand. However, the notion of a significant demand surge driven by lower rates appears to be fading, even with the market’s expectations for cuts.
As a result, interest rate–sensitive sectors like housing may remain out of favor until there are clear signals that rate cuts are warranted such as a meaningful deterioration in economic data.

As uncertainty eases, the S&P 500 has begun to outpace defensive sectors. With risk perceptions improving, investors are rotating out of counter-cyclical and defensive positions and moving further out along the risk curve. This shift reflects a renewed appetite for cyclical exposure and growth-oriented assets as macro and earnings visibility improve.

Unprofitable tech continues to move higher.

Unprofitable has historically (short-time horizon) tended to perform well during periods of rate cuts.

Rates
If 2s10s continues to steepen and Z5Z6 steepens throughout year-end, we will get easier financial conditions.

The fact that the 2s10s curve is steepening while the Z5Z6 spread is flattening suggests there are no significant underlying growth concerns.
We anticipate more upside surprises through the remainder of the year. However, at present, the yield curve dynamics show limited steepening in Z5Z6 and more pronounced steepening in 2s10s a pattern that does not indicate underlying growth worries, despite Powell’s comment that “when it’s foggy, you slow down.

Bond markets are increasingly embracing the potential for additional Fed rate cuts. The front end of the curve has already declined, and now long-dated yields are beginning to catch up.
Steepener trades are being unwound, and the market appears enthusiastic about the prospect of roughly 125 basis points of cuts between now and 2026.
That said, this is not yet my base case I still view inflation risk as a lingering concern but it’s clear that sentiment in the market is shifting.

At the moment, the 10-year yield is most sensitive to employment surprises. In the short run, every 1-unit change in the employment surprise index tends to move yields by roughly 30 basis points.
Overall, a 1-unit increase across inflation, employment, and economic surprise indicators combined has about a 40-basis-point total impact on the 10-year yield.
In the short-run dynamics, employment surprises have the largest immediate effect. However, over a 120-day rolling basis, inflation surprises become the dominant driver of yield movements.

Post FOMC as taking a more gradual approach toward neutral policy.
If stock markets struggle to sustain record highs and begin to roll over, that would likely prevent further downside in yields.
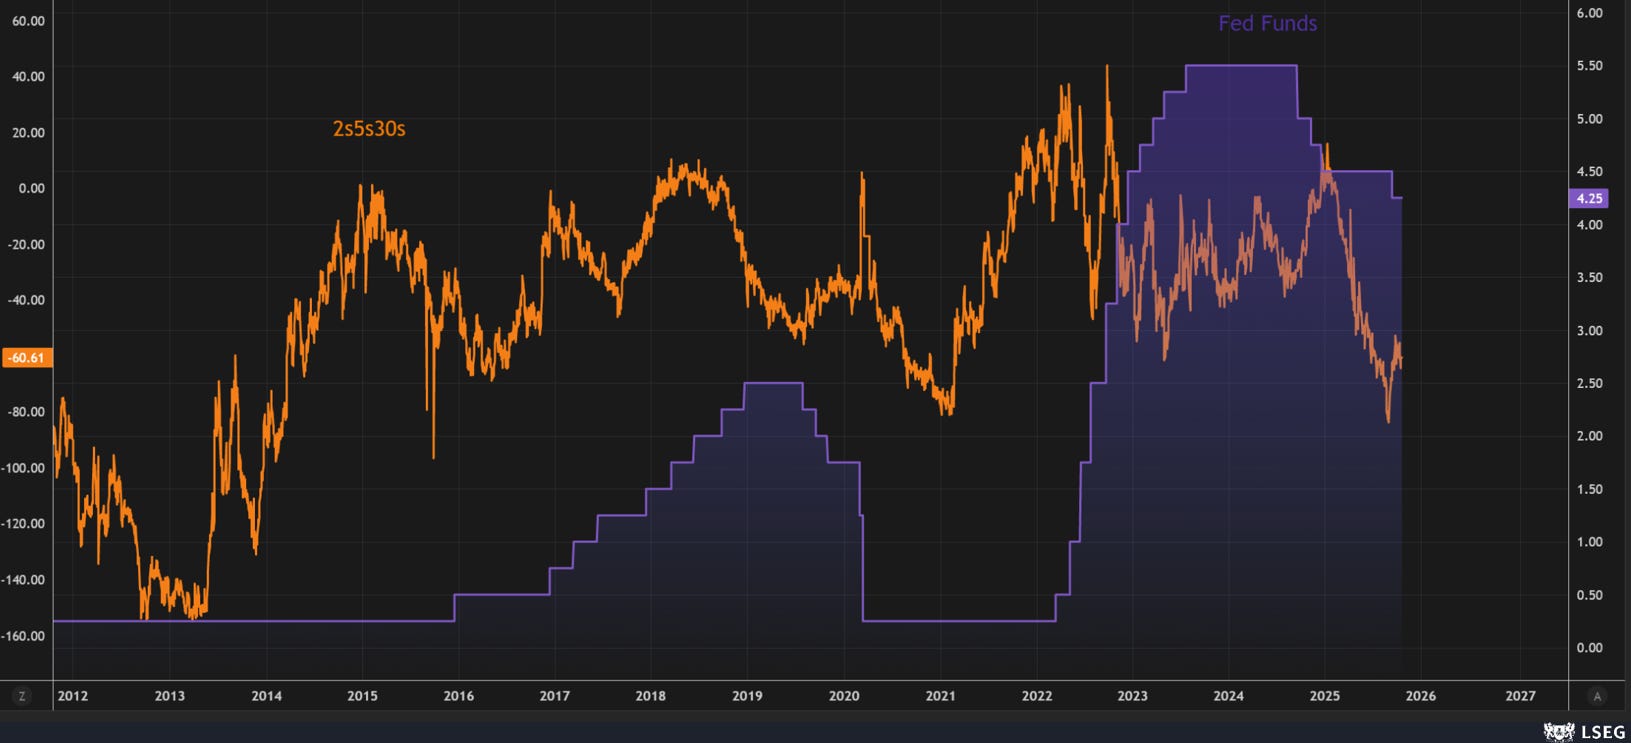
In terms of the curve, the 2s5s30s fly suggests that if the Fed continues to move slowly toward neutral, the belly of the curve will likely take the lead in pushing rates higher.
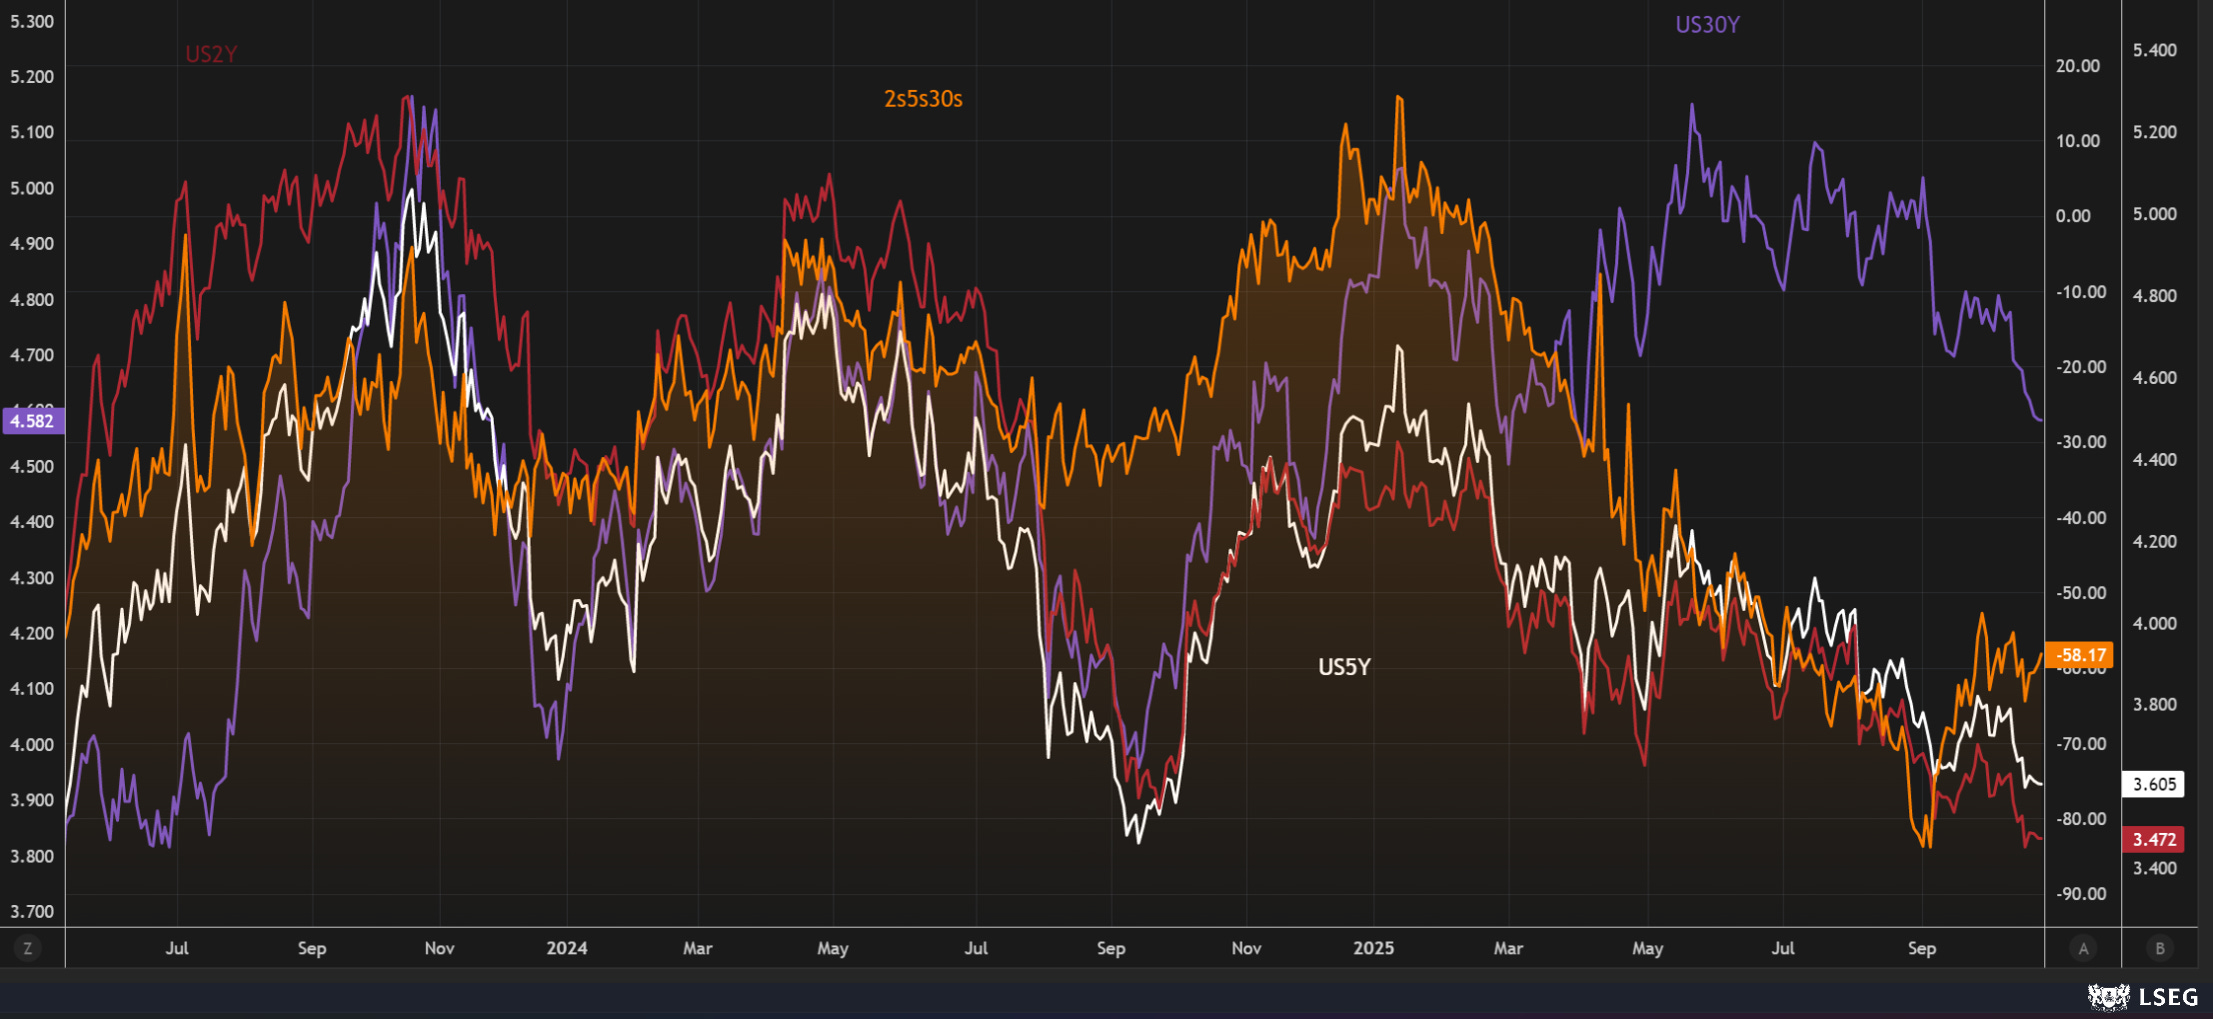
The above refers to a situation in which the Fed takes it slow, causing the belly of the curve to push rates higher. The 5-year remains extremely rich, reflecting strong investor demand for duration. The market is signaling that a period of rate cuts is approaching.
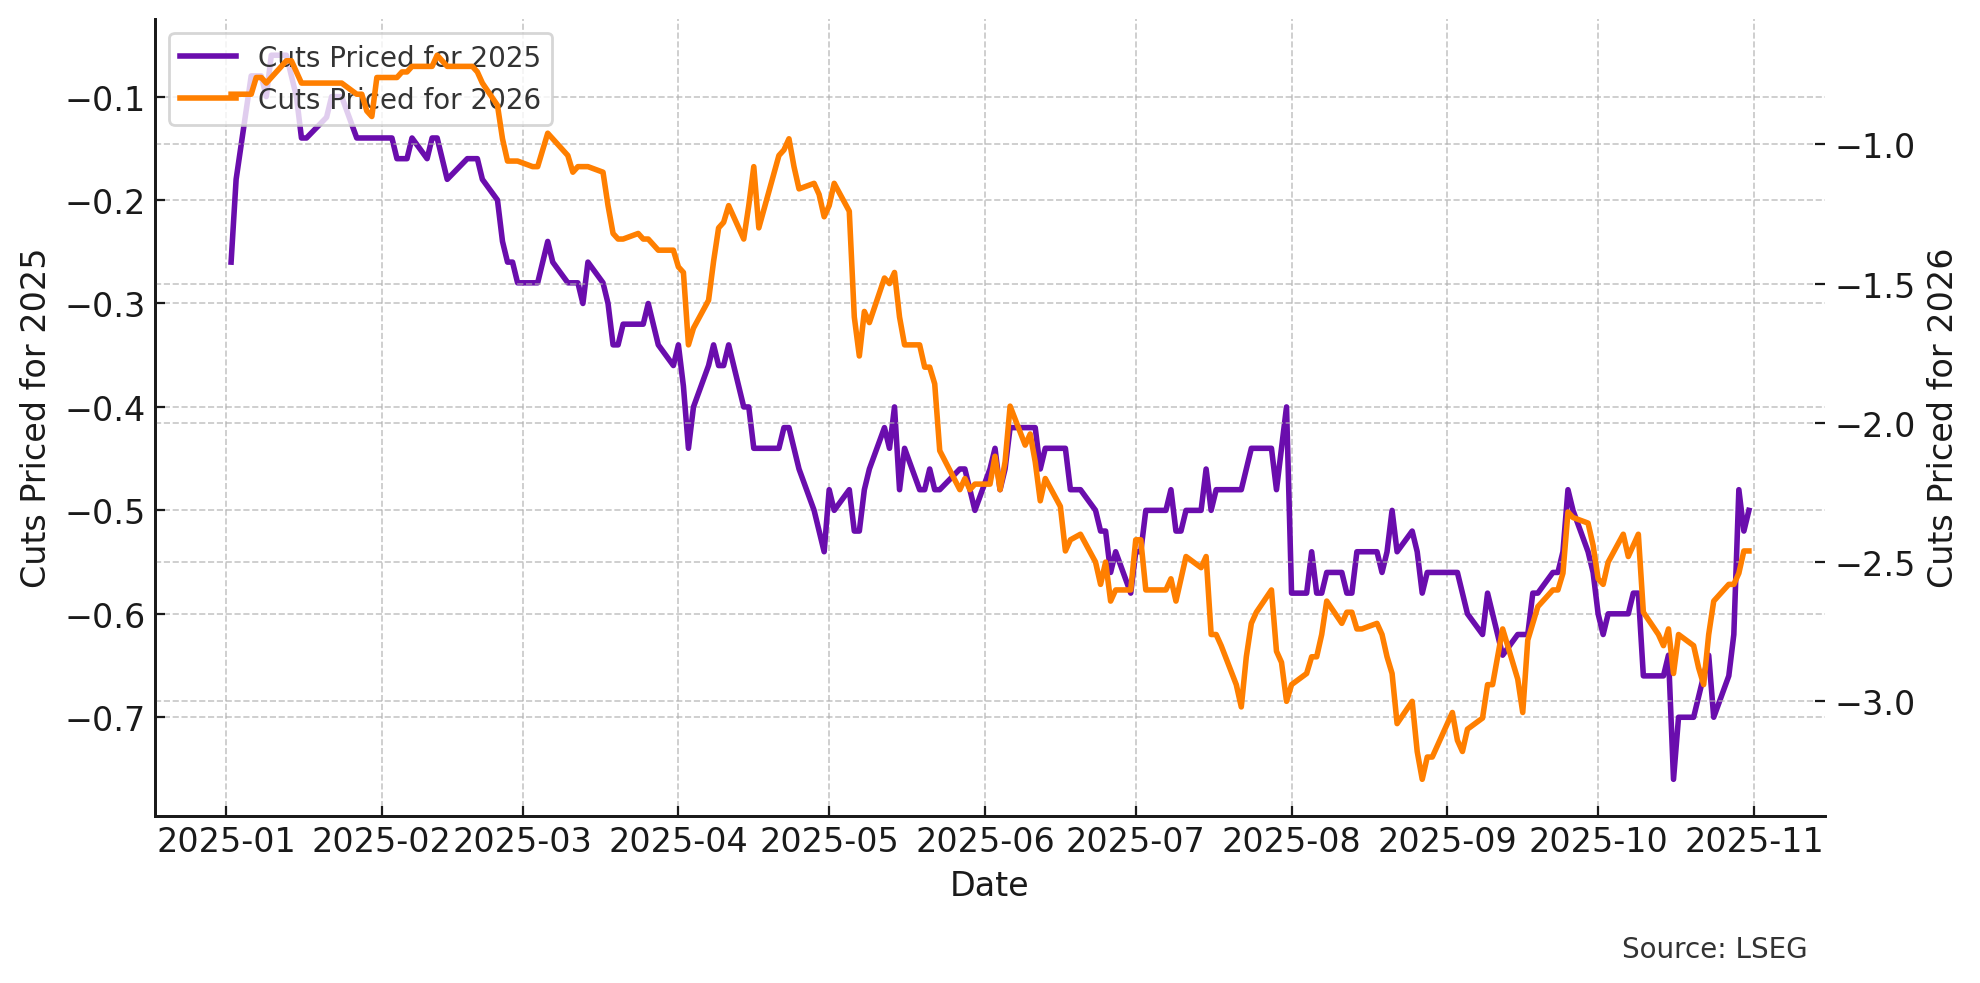
Powell surprised markets one day after the decision to cut rates by 25 bps in October, stating that another interest rate cut in December was not a “slam dunk.” Rates responded accordingly markets are now pricing in only about half a cut for the end of the year (meaning less than a 25 bps cut is currently expected). For 2026, rate expectations have also shifted, with projected cuts moving from three to roughly two and a half.
Looking at the curve, we can see that rates are now being priced around 3.2%. Markets are beginning to recognize that rate cuts are not as necessary, as Powell pointed out that such cuts would do little to support the economy at this stage.
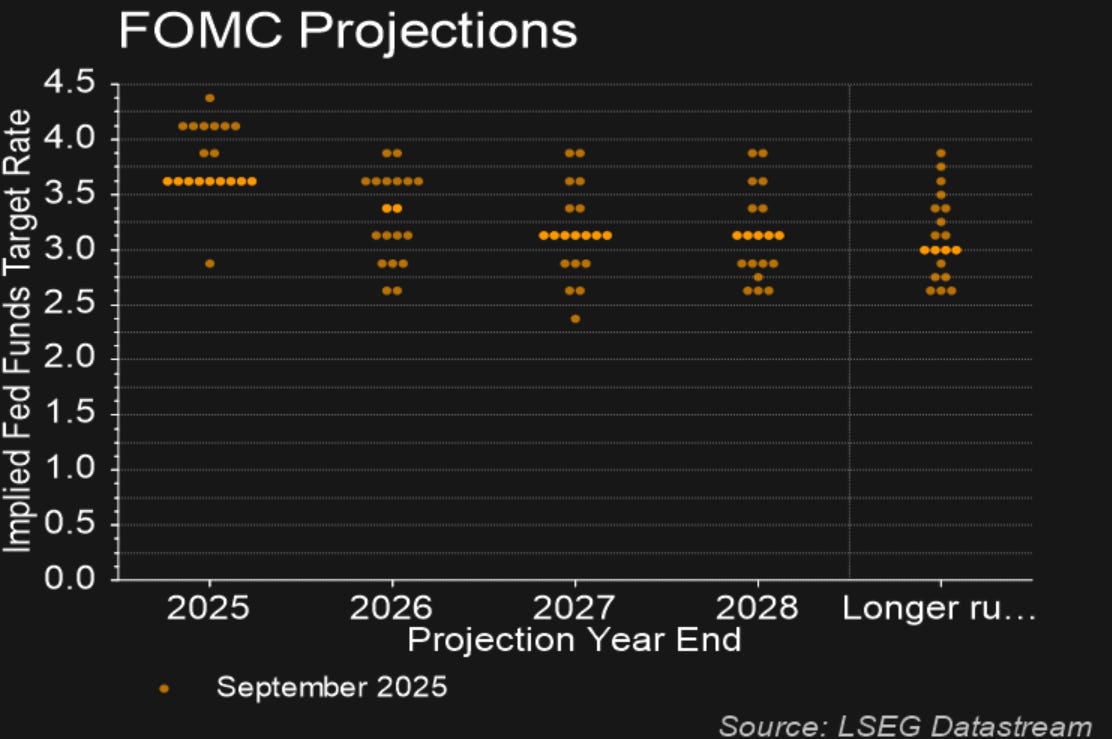
This brings us to the dots looking at the darker dots those are the median dots and looking at the outliers can deduce who are the clear dissenters.
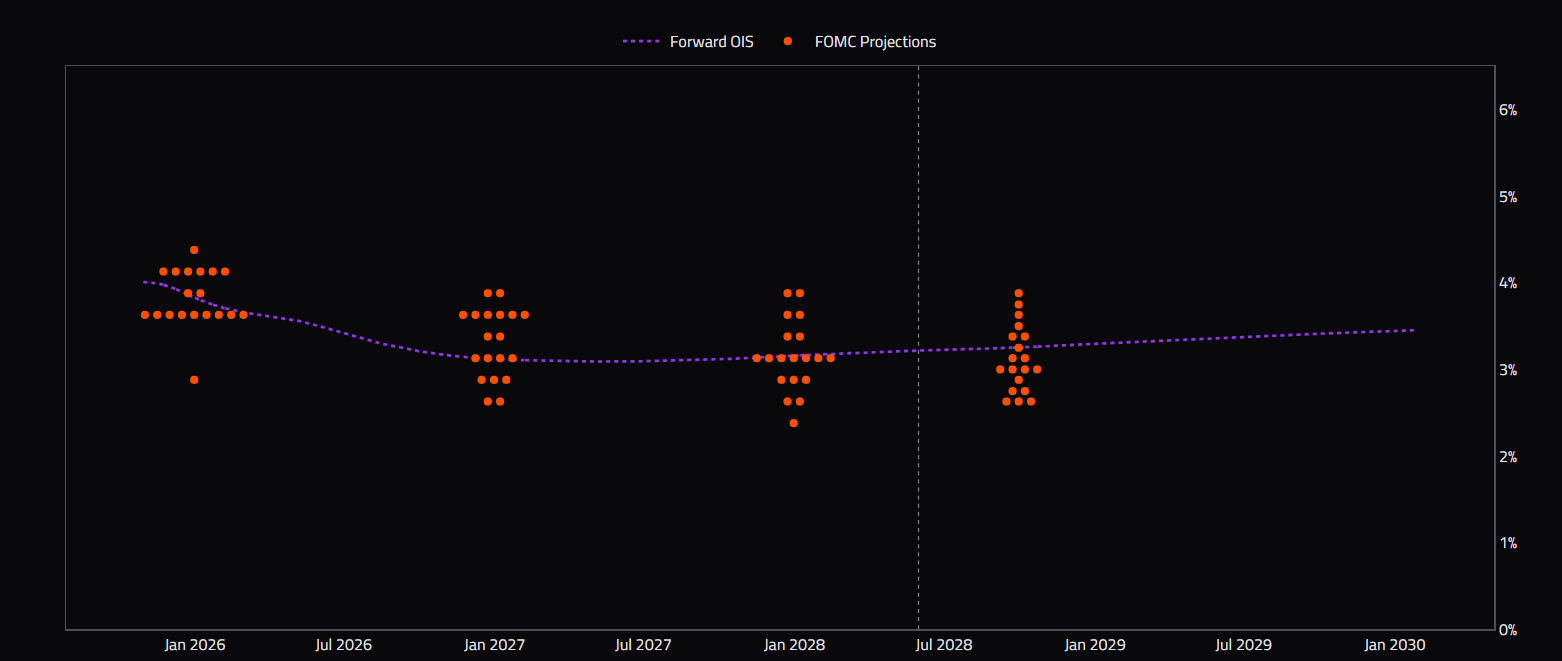
Forward OIS priced above median dots for 2025, falls inline for 2026 and 2027 and rises above median dots for longer-run.
Credit
PIK issuance volumes have risen sharply.
Monthly PIK issuance typically remains below $100 million, but recently exceeded $2 billion, with the most recent month recording about $500 million.
Historically, Net Debt to EBITDA tends to lead PIK issuance by roughly six months, while EBIT to Interest Expense leads by around eight months.
In other words, deterioration in leverage and coverage ratios generally precedes spikes in PIK issuance.

When leverage climbs and coverage thins, companies start reaching for tools that buy time and few instruments say “late cycle” more clearly than PIK notes.
The chart above shows how high-yield leverage (Net Debt/EBITDA) and interest coverage (EBIT/Interest) evolve alongside PIK issuance. As balance sheets weaken leverage rising and coverage falling the market shifts from purple to orange, signaling a move from mid-cycle comfort to late-cycle stress.
The surge in PIK volumes over 2024–2025 isn’t random. Historically, these instruments lag deteriorating credit fundamentals by about 6–9 months, emerging when liquidity tightens and cash-flow cushions disappear.
In other words, PIK issuance doesn’t cause credit stress it reflects it.
When borrowers can’t pay cash interest, they start paying in kind. That’s the canary in the coal mine for high-yield risk sentiment.
The broader U.S. corporate sector remains on relatively solid footing.
Yes, cash balances have edged lower, but most companies have been disciplined: using excess liquidity to pay down debt or rebuild balance-sheet flexibility, rather than stretching leverage. Across large-cap and high-yield borrowers, the general picture is one of prudence, not panic.
The chart above shows that rising PIK volumes tend to follow periods of higher leverage and weaker interest coverage, often with a 6- to 9-month lag. Historically, that shift signals tightening financial conditions but not necessarily immediate stress.
So far, the current earnings environment and macro backdrop don’t show flashing red lights. Cash flow generation is holding up, and refinancing pressures remain manageable. In short, PIK issuance is picking up but the credit market still looks resilient rather than distressed.

BBB remains the largest dollar amount of corporate debt at almost 5 trillion, or roughly 40%.

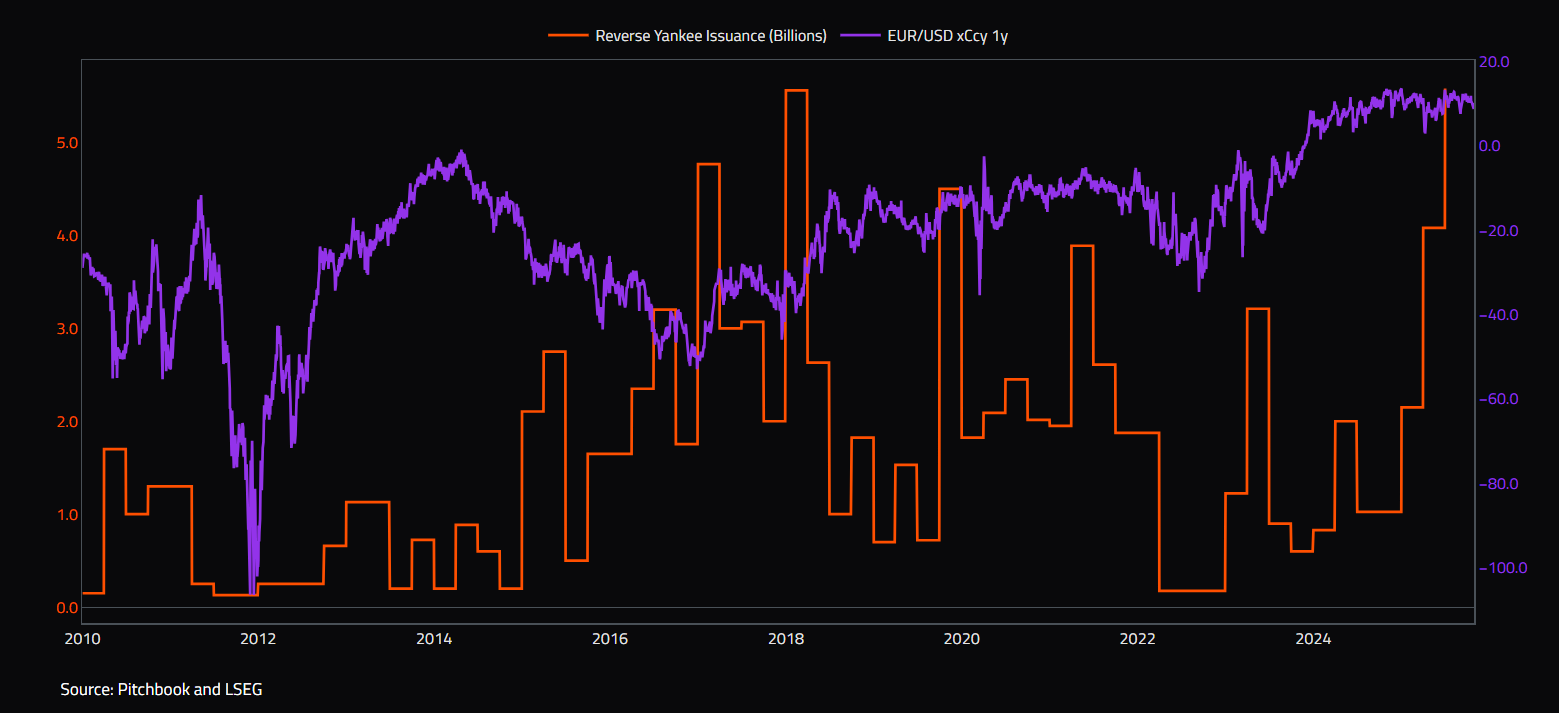
When the EUR-USD cross-currency basis is tight, it lowers the cost of swapping euro proceeds back into dollars. This makes issuing euro-denominated debt more economically attractive for U.S. corporates, especially when compared to higher all-in yields in the U.S. domestic market. In effect, EUR-denominated spreads are often tighter, and when adjusted for hedging, the all-in cost of capital can be materially lower than issuing in USD.
As a result, we are seeing a growing pipeline of Reverse Yankee issuance—particularly from investment-grade U.S. corporates seeking to optimize funding costs and diversify their investor base. Given current market conditions, and as the xCcybasis remains relatively tight, we expect this trend to persist, with continued growth in Reverse Yankee supply.
This shift also reflects broader capital market dynamics, where currency-hedged relative value opportunities and global investor appetite for yield-efficient paper continue to shape issuance decisions.
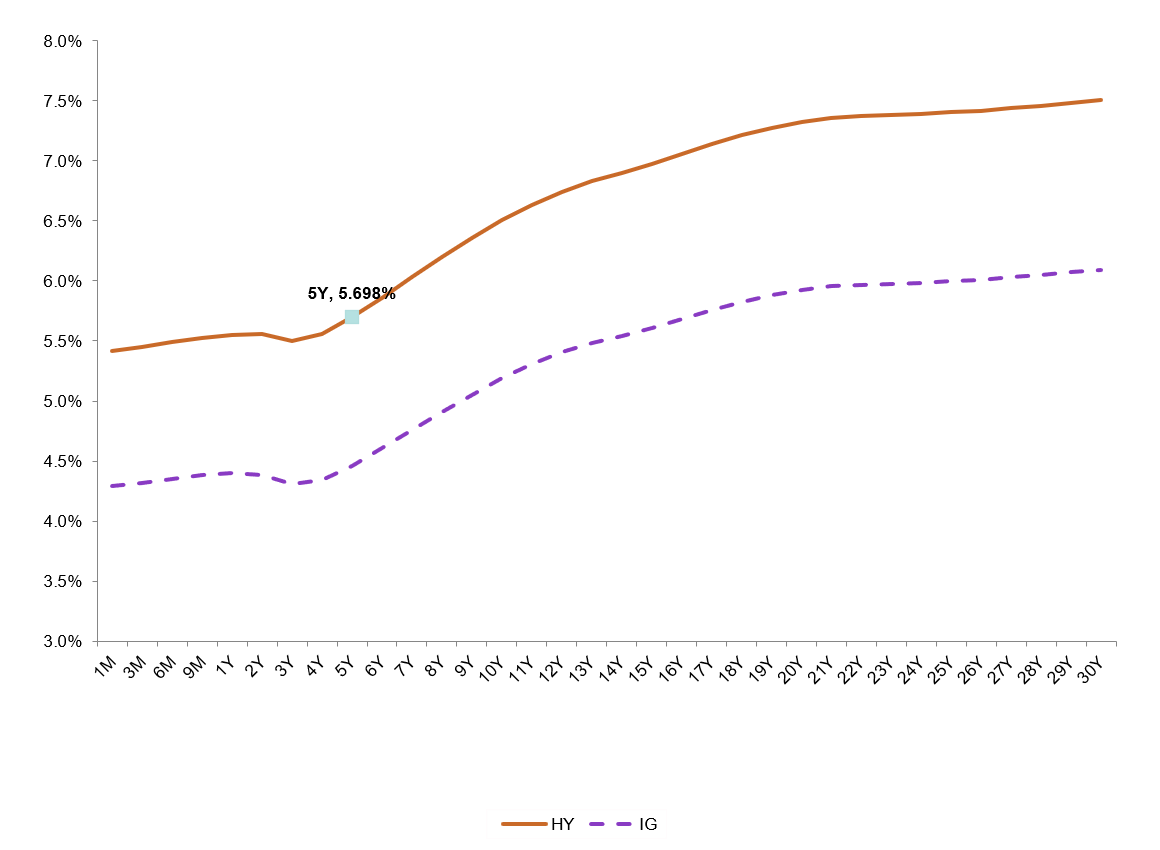
Across both the High Yield (HY) and Investment Grade (IG) credit markets, corporate spreads remain expensive, particularly as the yield curve has steepened in recent months.
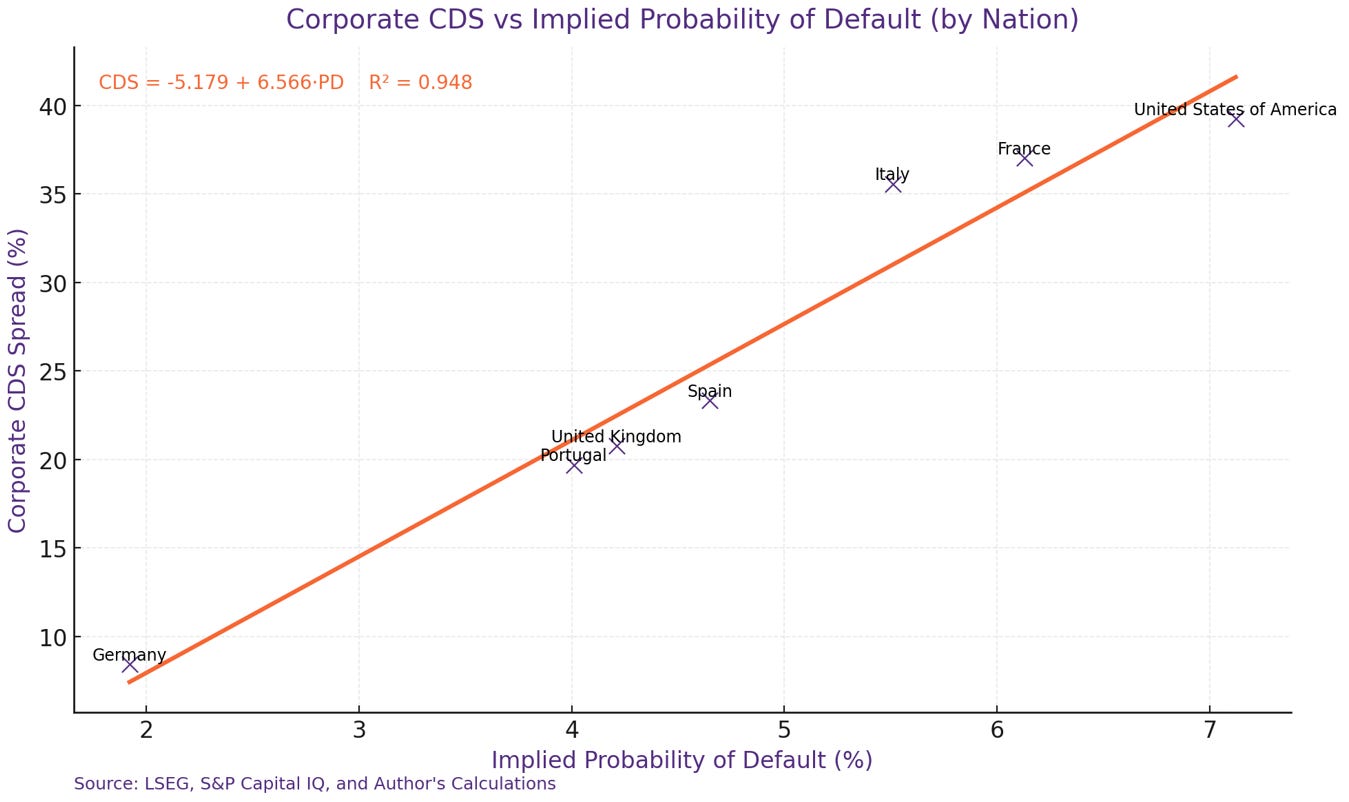
Below shows CDS (weighted) versus the probability of default. The probability of default is constructed using market variables and financial metrics to assess the likelihood of a company failing. This measure also includes zombie companies, which helps explain why the U.S. appears as an outlier given the higher weighting of such companies in the U.S. However, if we excluded those, the U.S. would be in a much stronger position. As mentioned above, U.S. companies have built substantial cash stockpiles and paid down debt, leaving most firms in a favorable financial position.
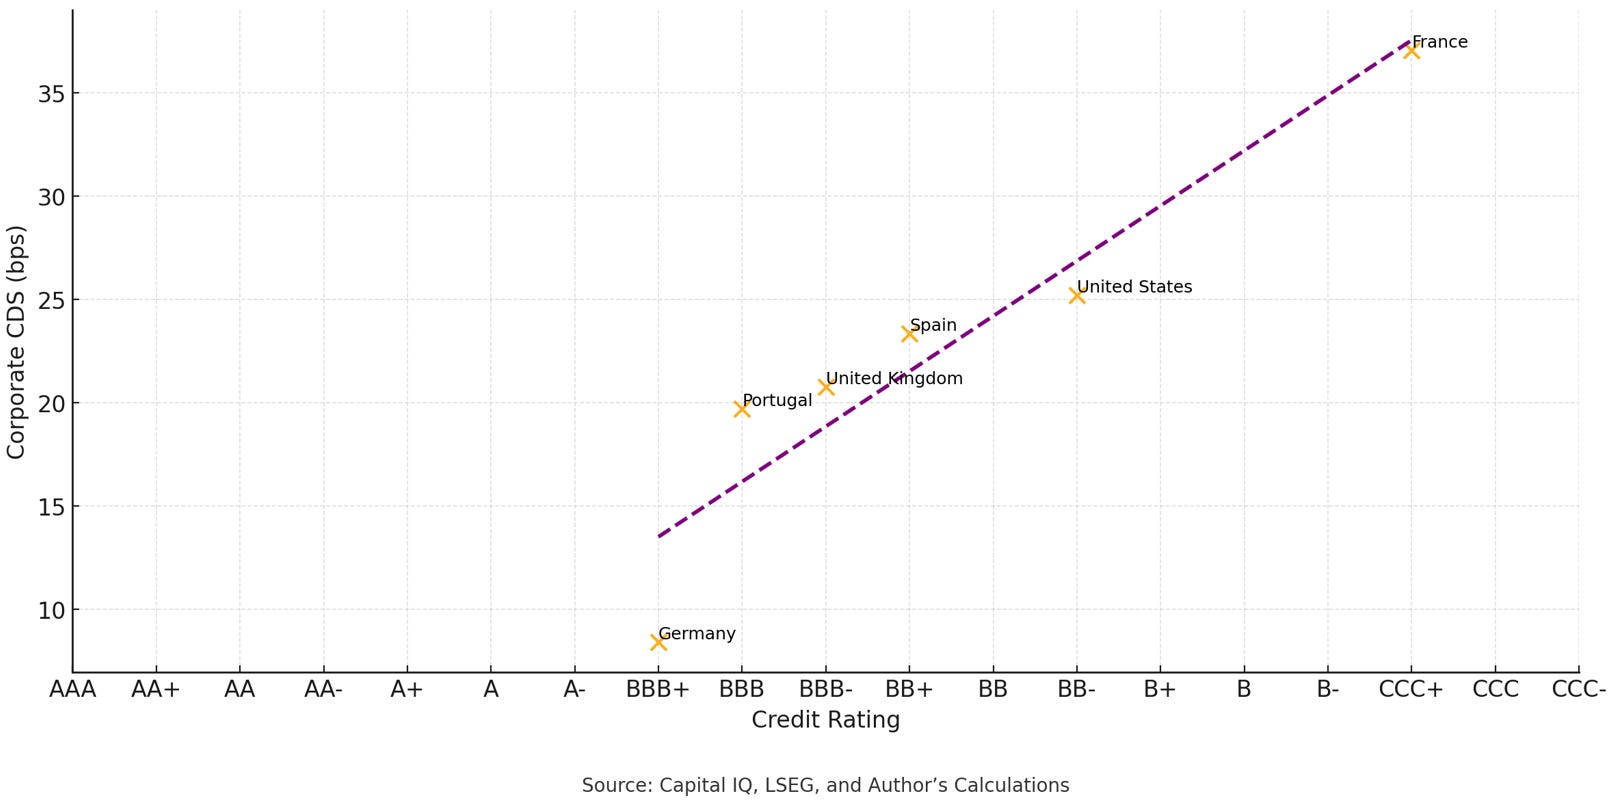
If we strip out zombie companies and focus only on firms with an implicit credit rating covering both high-yield (HY) and investment-grade (IG) categories, the story changes. France stands out as a clear outlier, showing broad-based deterioration in corporate credit quality market implied rating across the board for France is CCC+.
FX
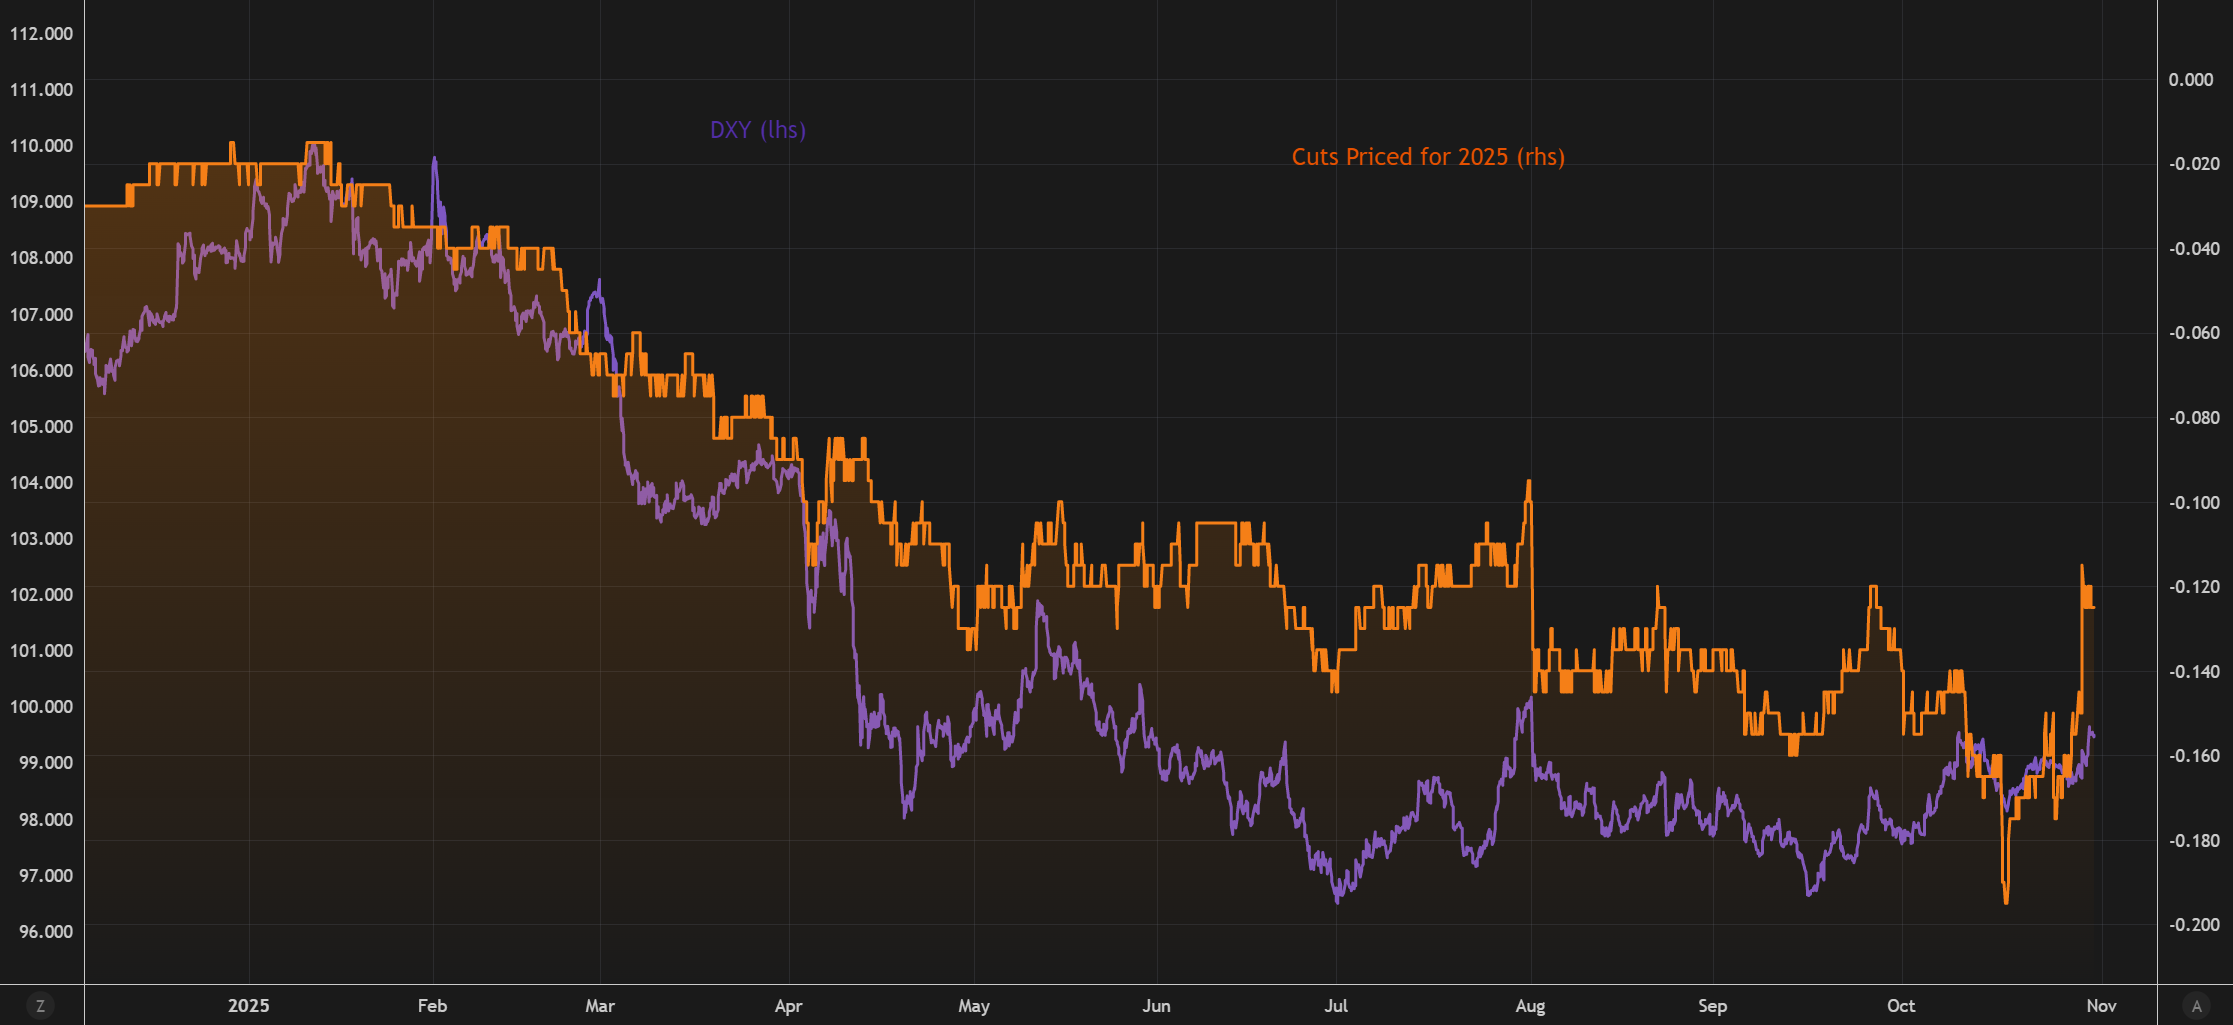
Pricing out of rate cuts should help lead to a boost in the dollar.
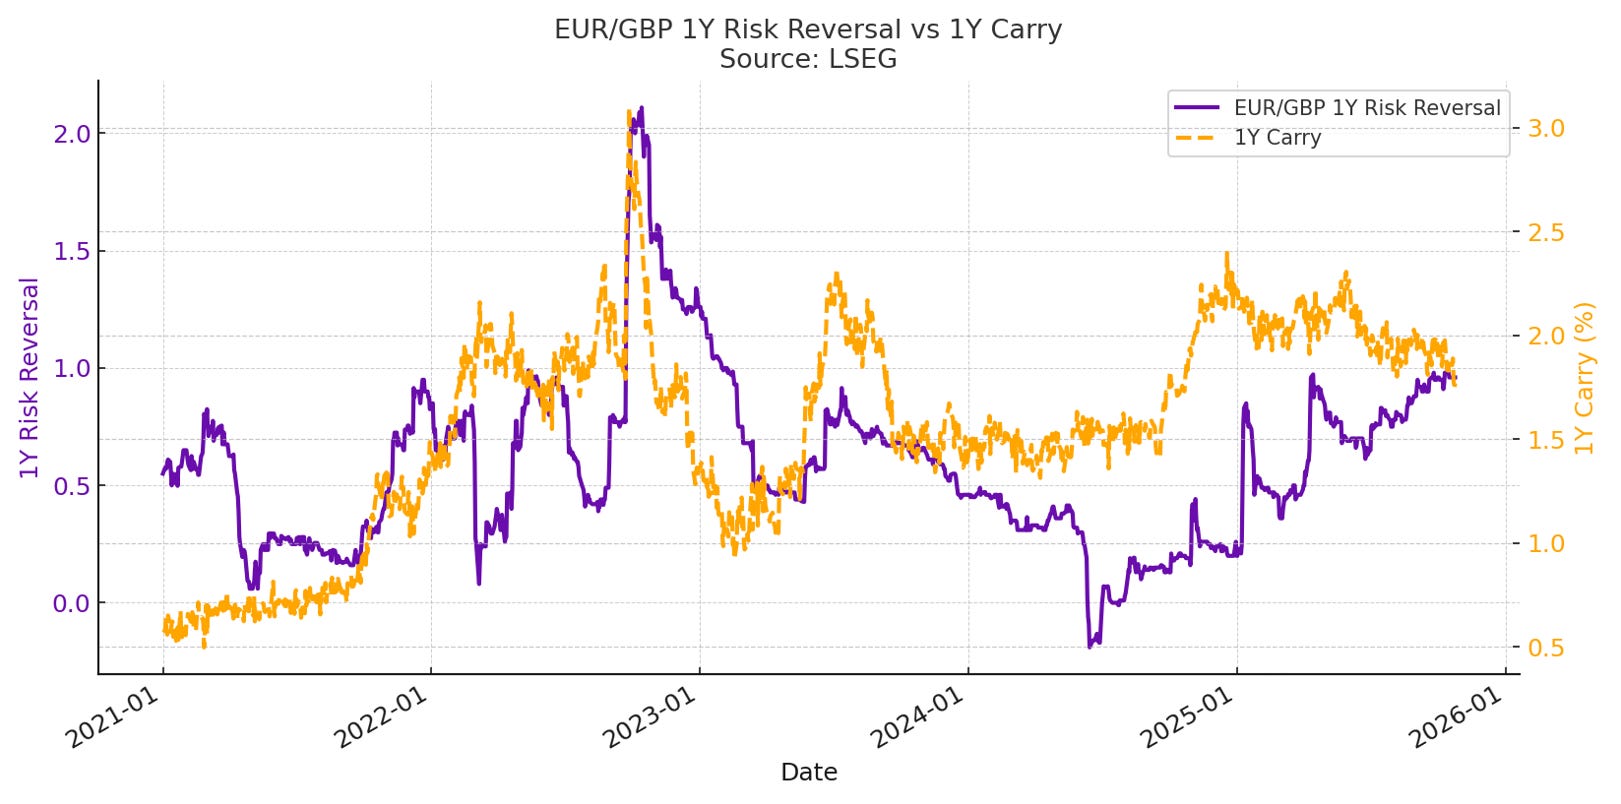
Carry is favoring GBP over EUR.
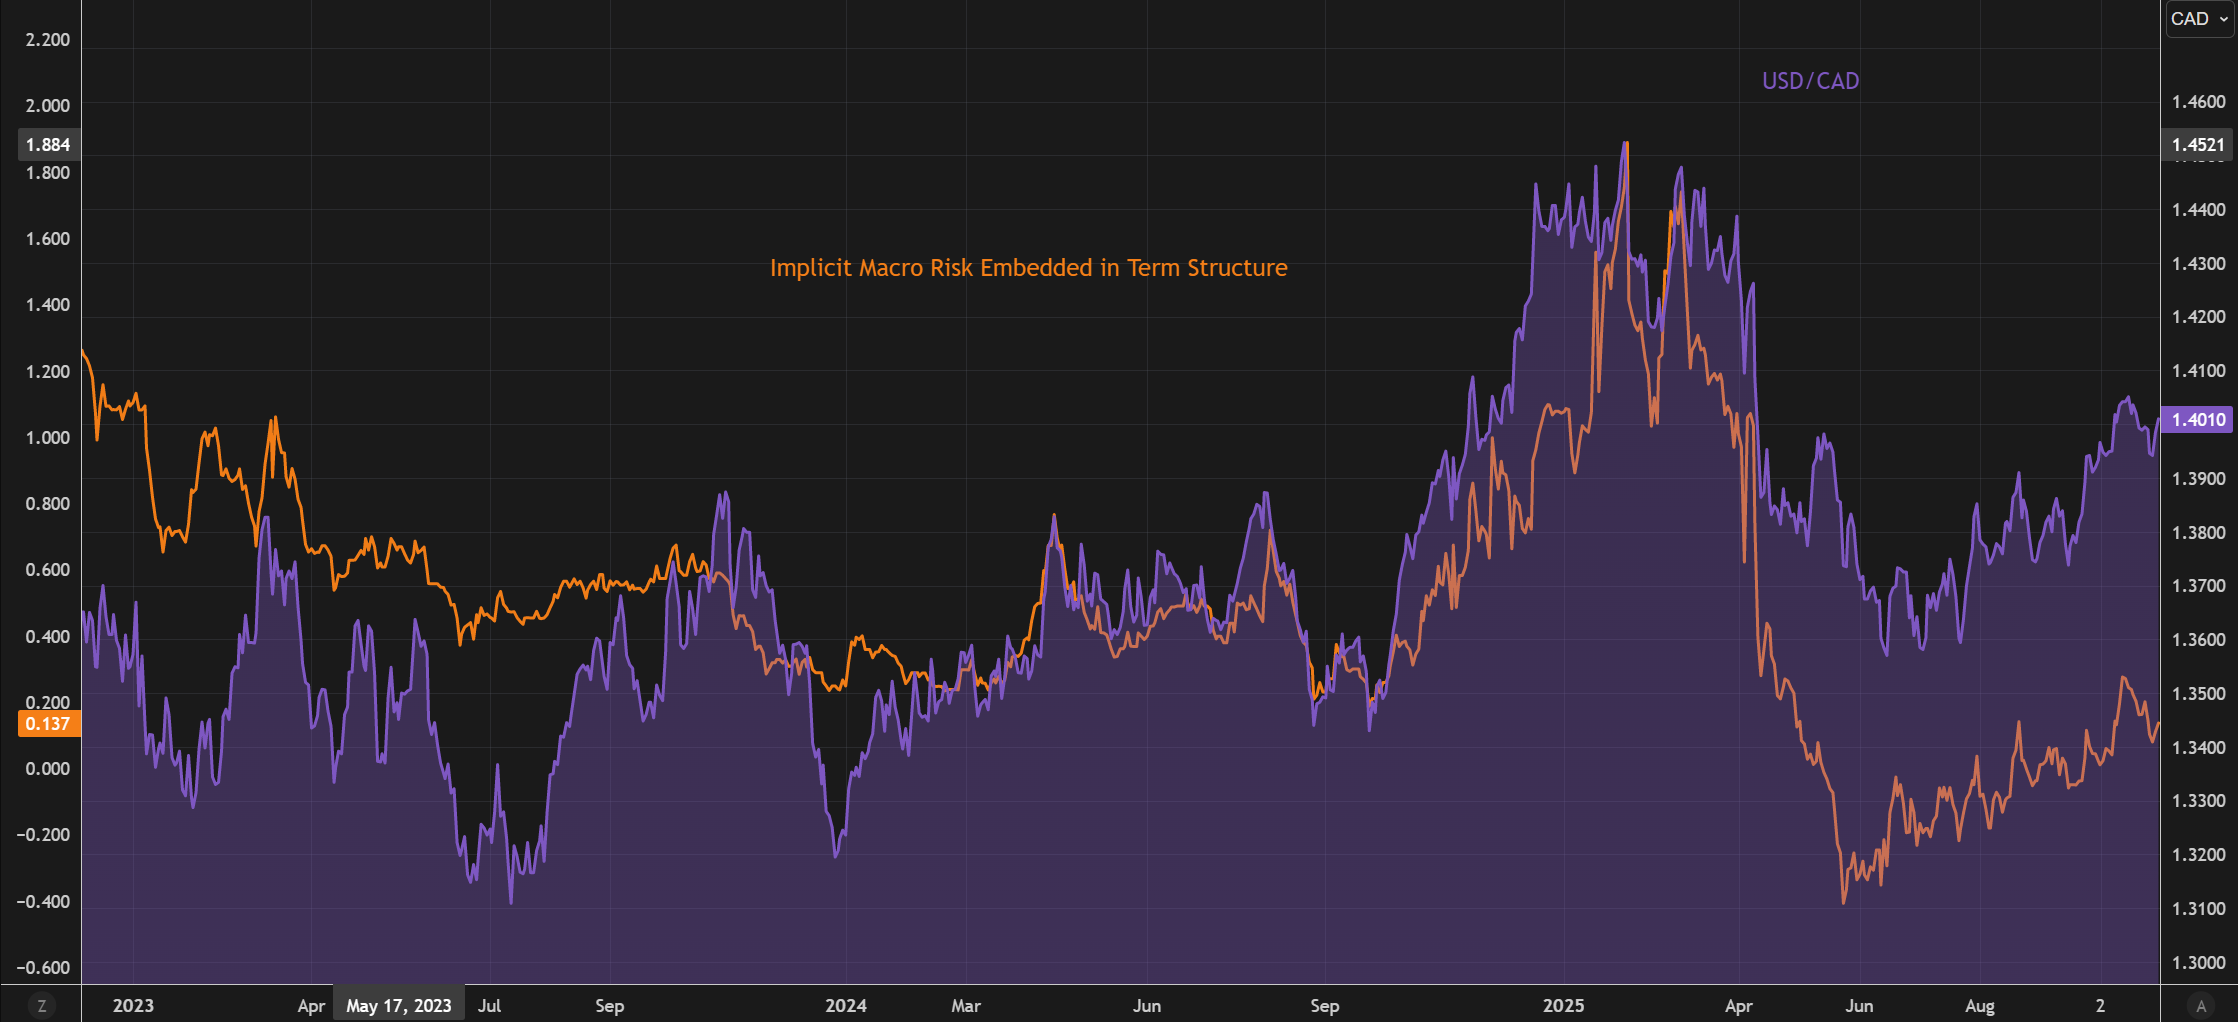
Still prefer short CAD here, embedded macro-risk implied by the term structure.
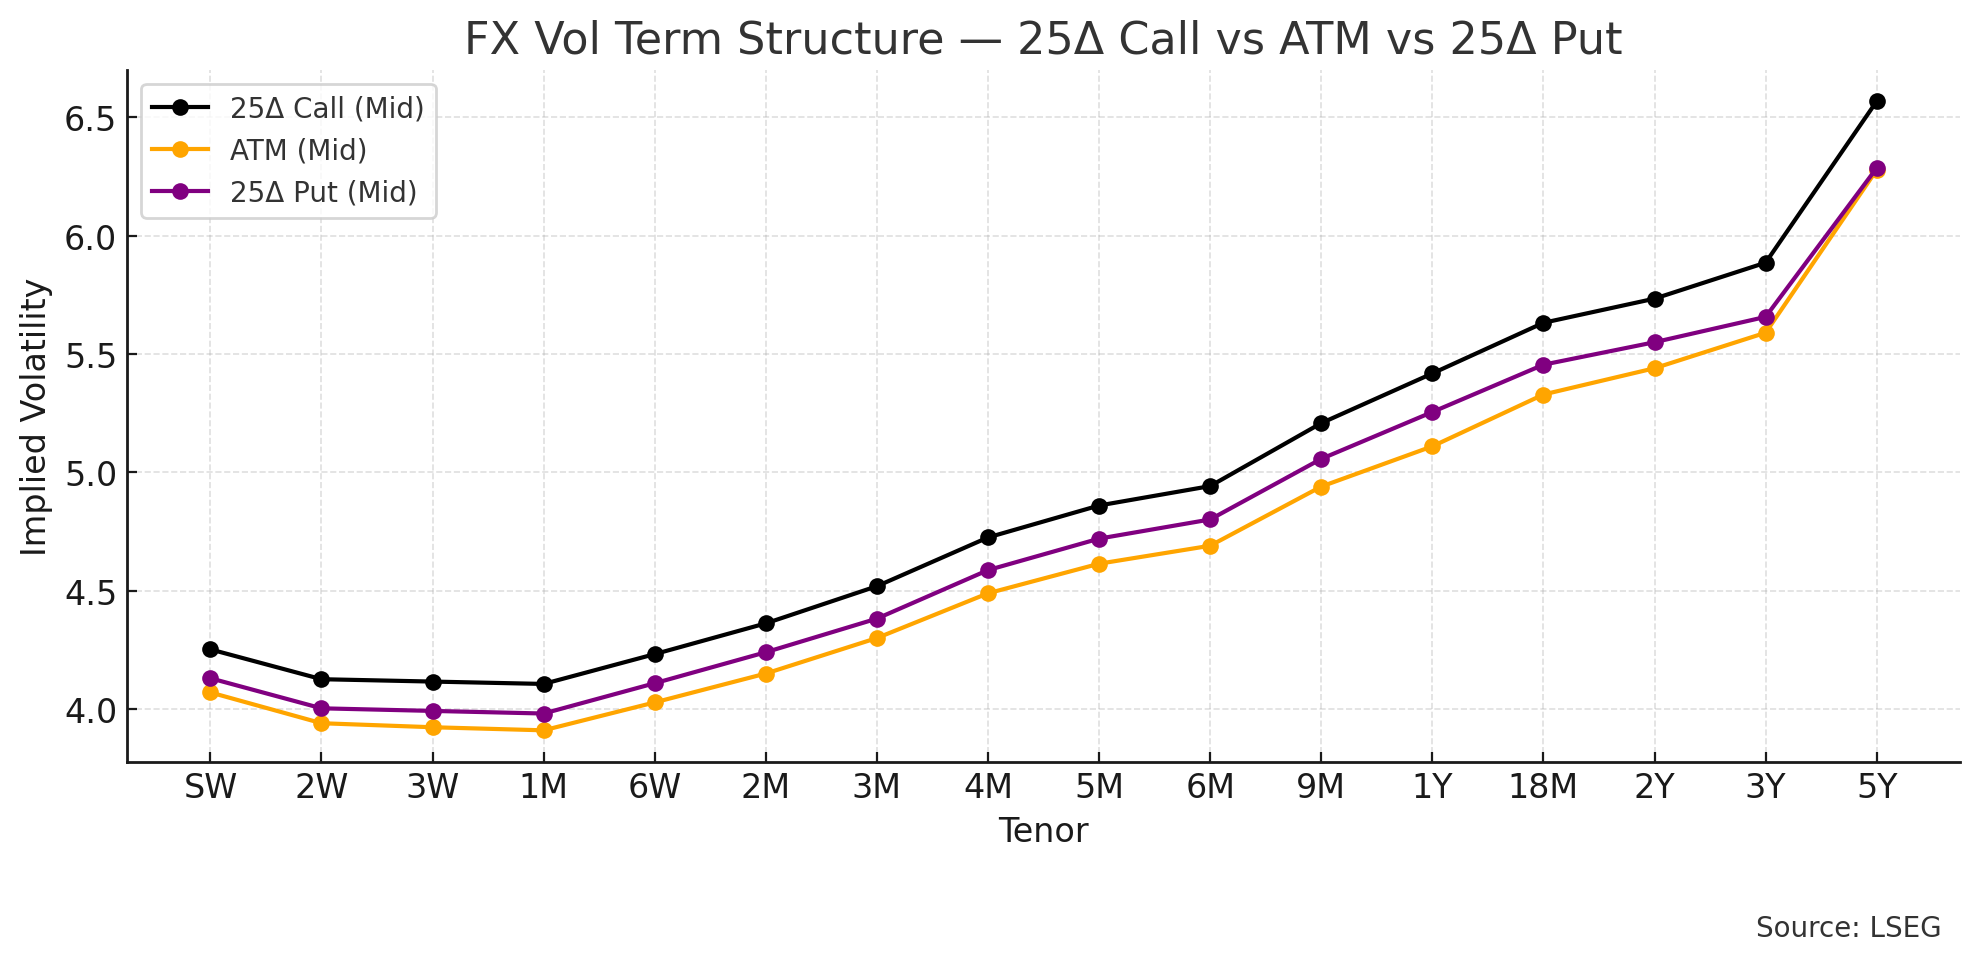
25Δ Call vol implies investors are paying up for USD calls (USD up) vs CAD, consistent with a macro risk premium that favors USD upside at longer maturities.
The market is pricing higher right-tail risk for the USD, i.e., stronger USD scenarios under stress.
Risk premia (carry unwind, safe-haven flows) grow with horizon long-term investors demand more protection against USD rallies.
This aligns with macro risk repricing: if volatility and risk aversion rise, capital tends to flow back into USD assets.
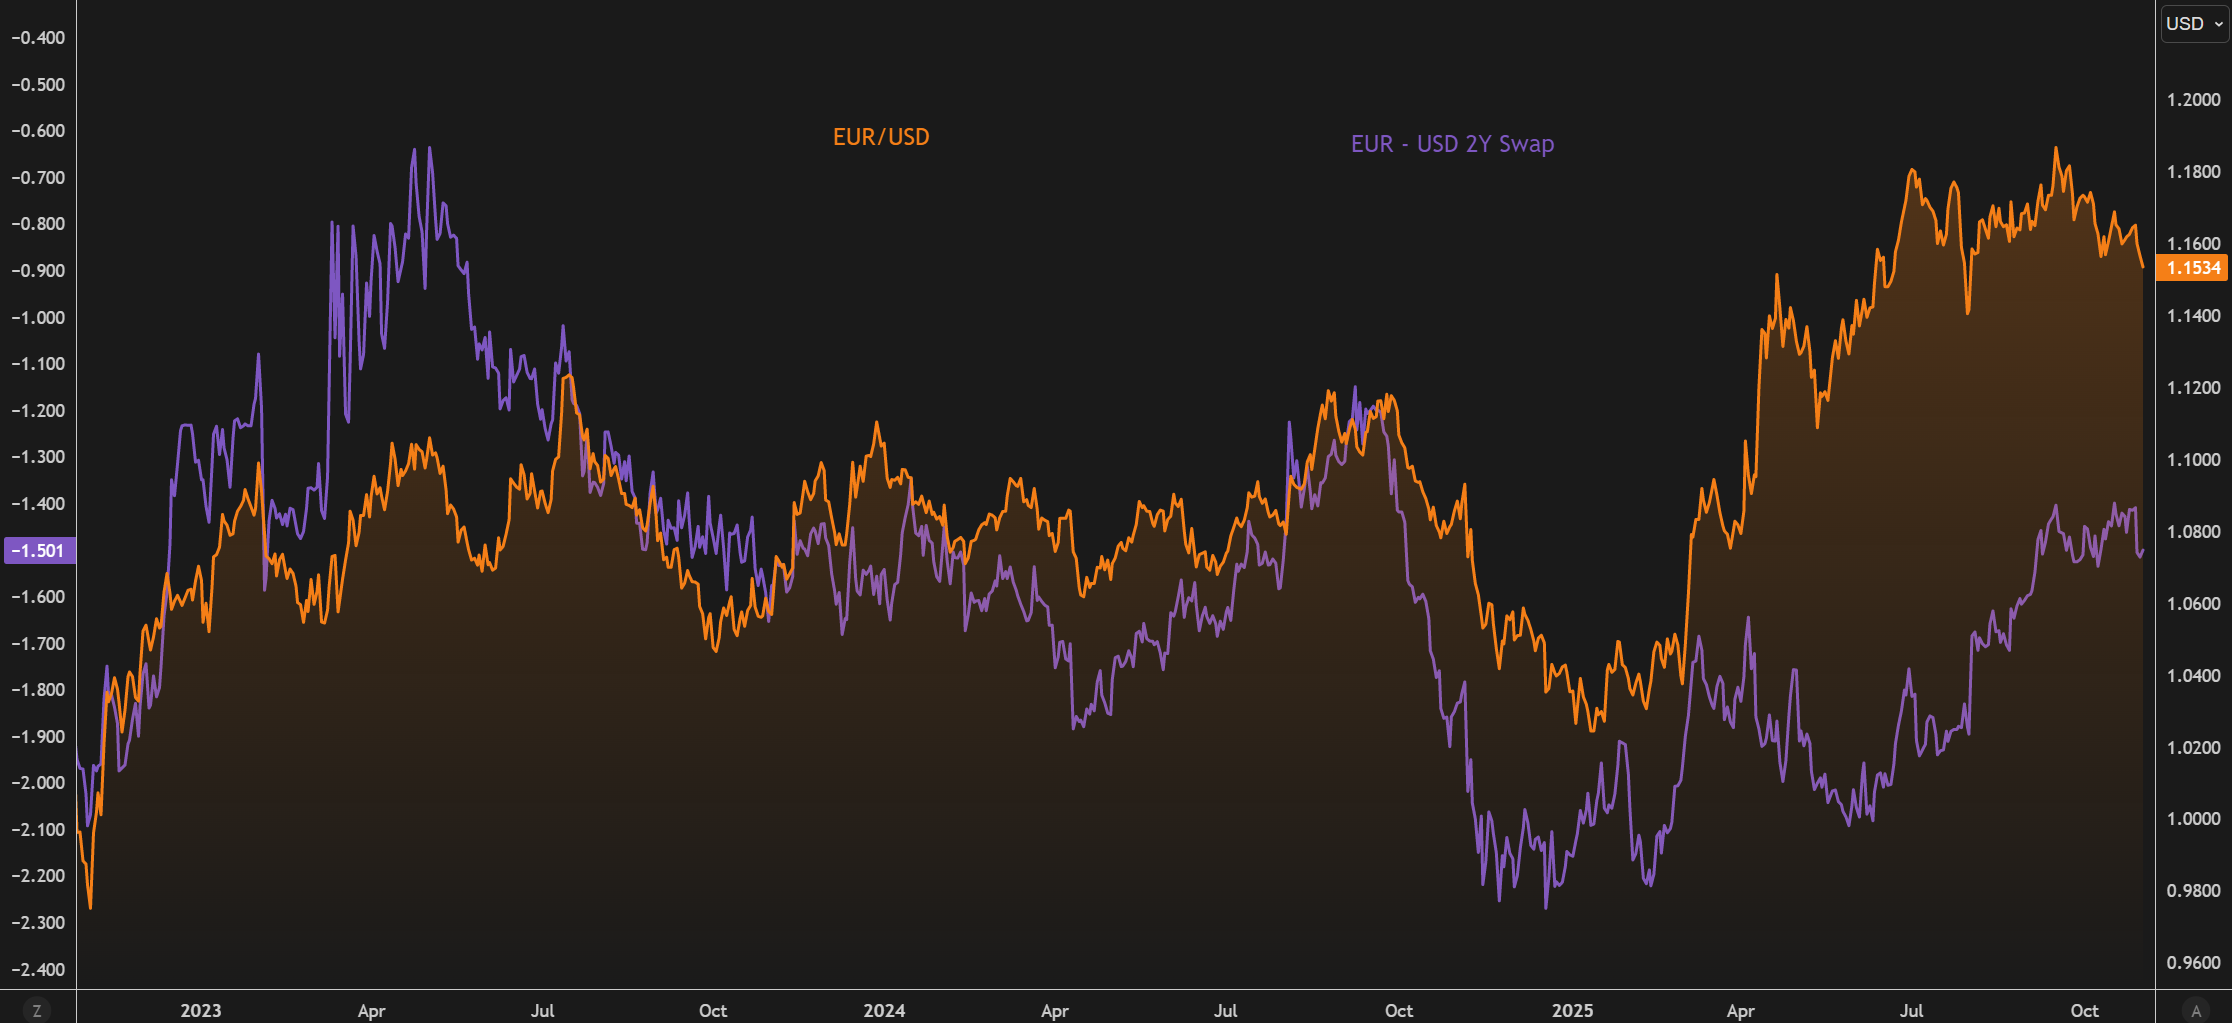
EUR/USD looks poised to favor dollar strength, especially as the potential for a December cut starts to be priced out. The ECB’s lack of forward guidance leaves many uncertainties in play. Greater clarity from Powell regarding the likelihood that markets should not expect a cut could provide additional support for the dollar, strengthening it relative to the euro.
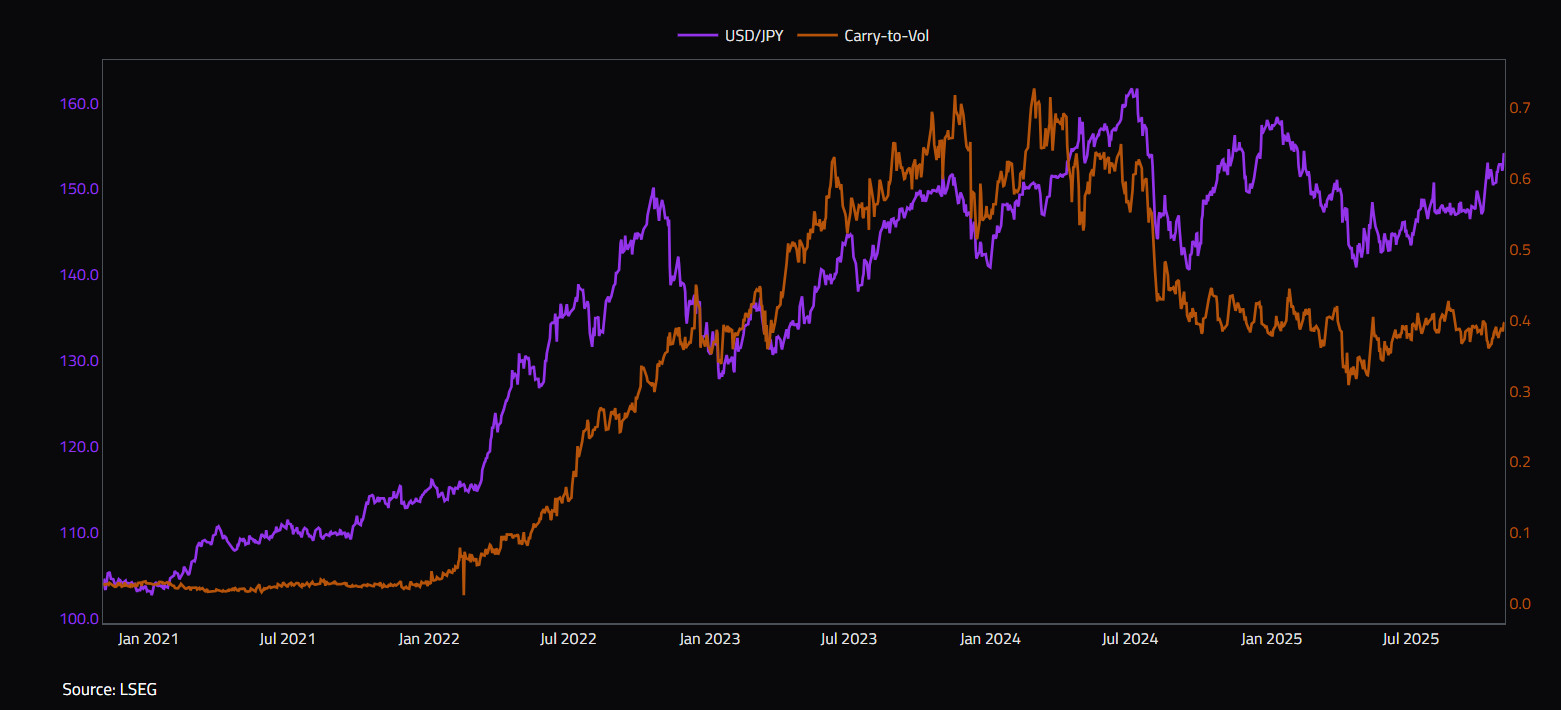
Despite some easing in USD/JPY differentials, overall volatility has declined even faster (in the denominator), boosting the carry-to-vol ratio and suggesting potential upside for the USD.
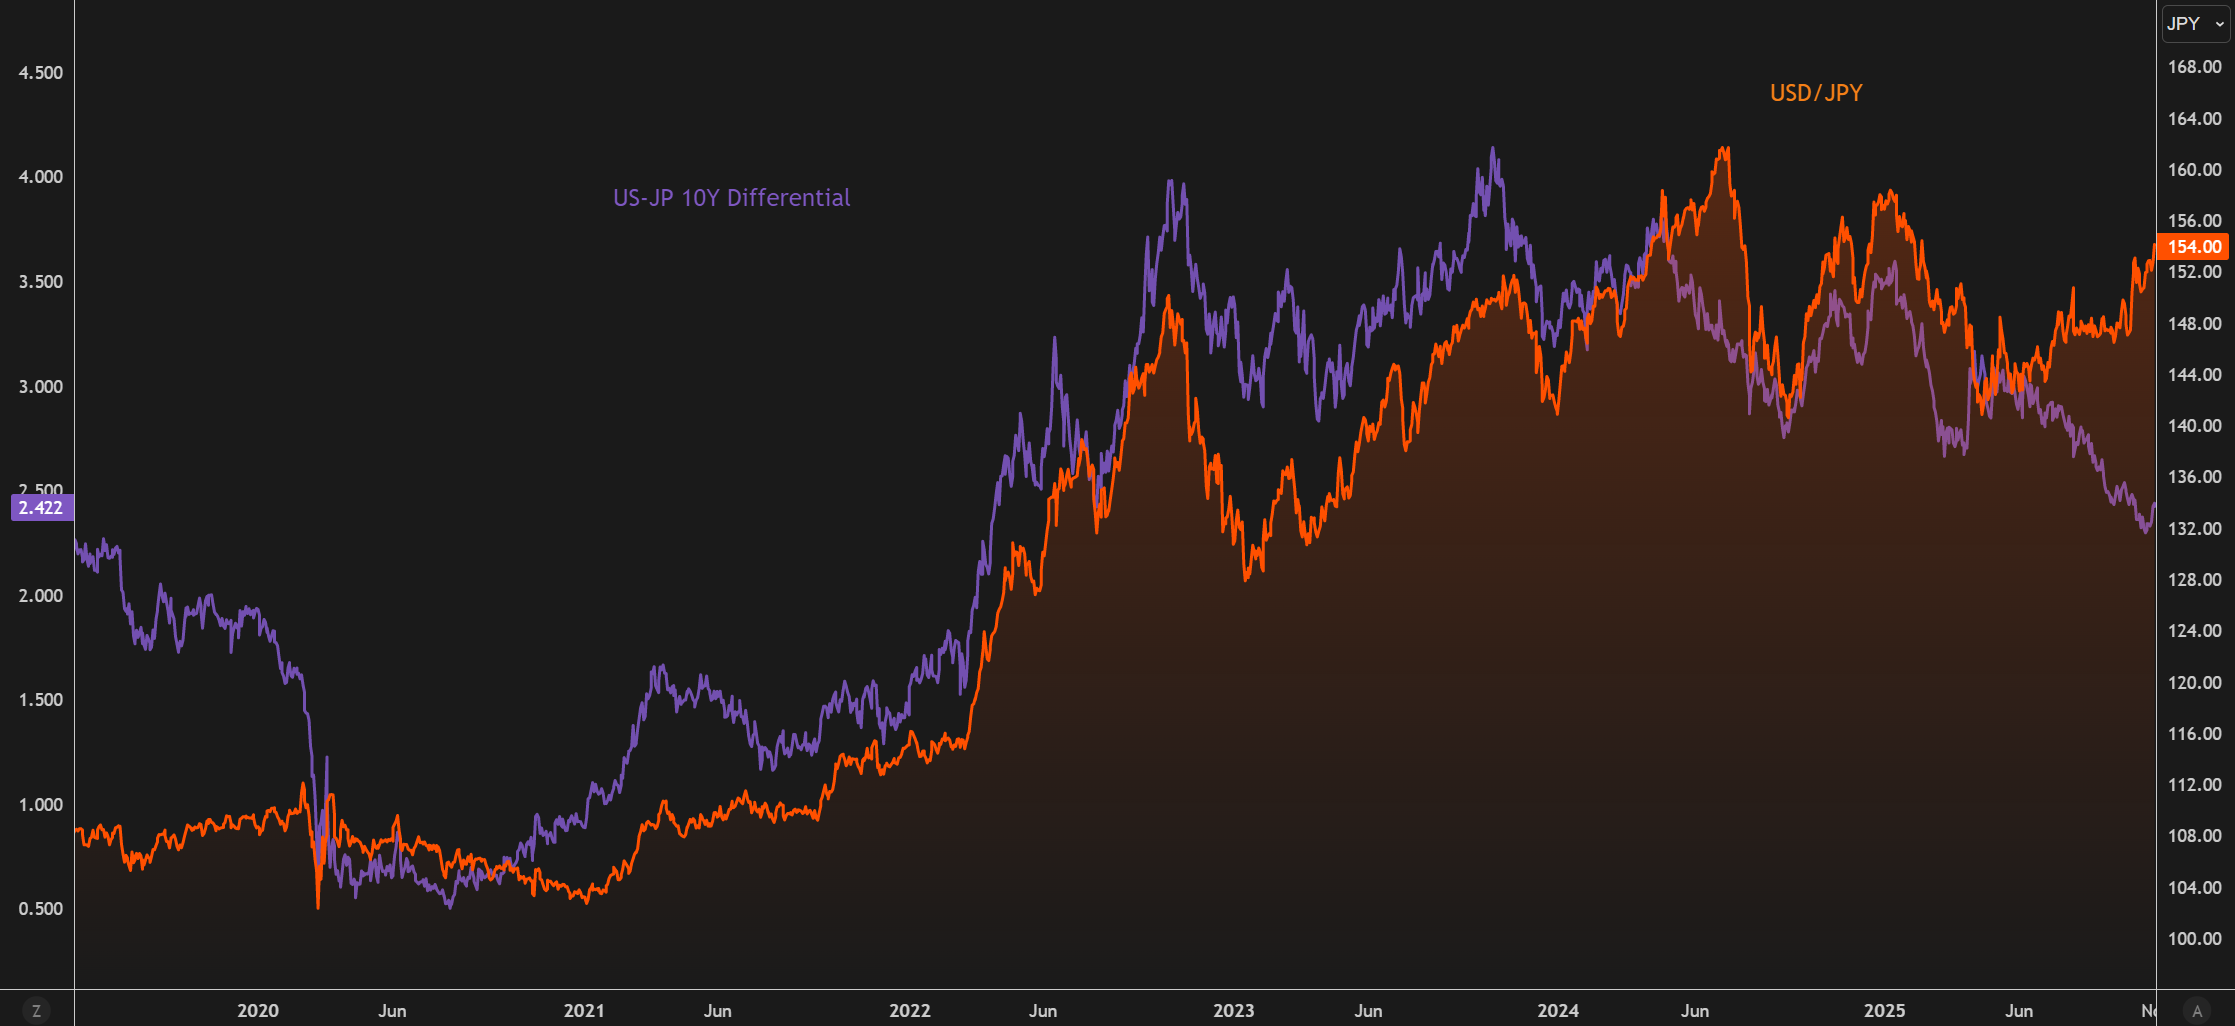
Yen has diverged from differentials
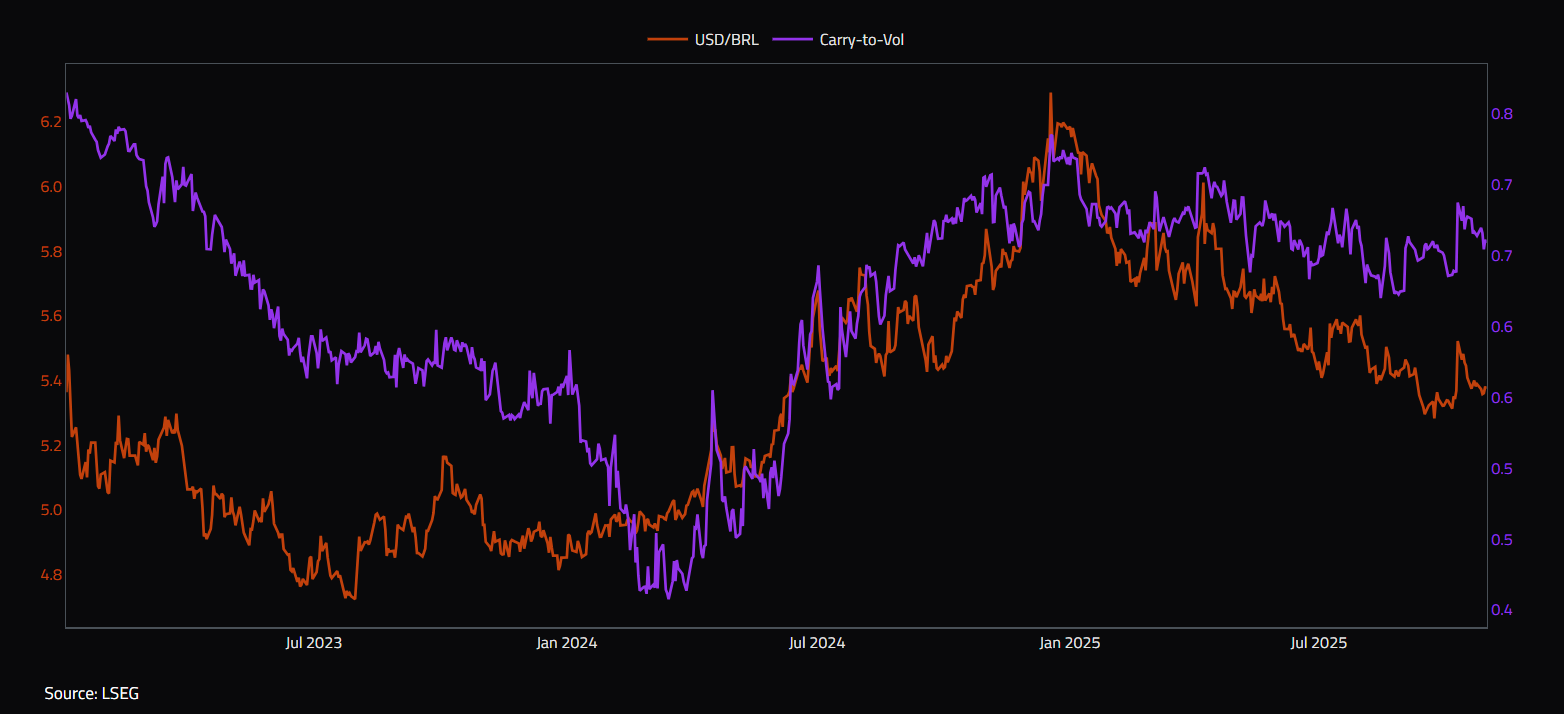
Expecting carry unwind, and this should help BRL to strengthen against the USD.
Conclusion
A lot has been happening across markets recently, yet there remain plenty of areas presenting opportunity. Overall, the macro backdrop in the United States continues to look solid, supported by resilient growth and moderating inflation. Chair Powell’s speech last week provided markets with additional clarity, leading to expectations for rate cuts being further priced out. Meanwhile, credit markets remain attractive, with spreads holding steady and fundamentals broadly supportive. Volatility across key FX pairs has eased significantly, creating several attractive opportunities for carry and relative-value positioning within the broader foreign-exchange space.