July Macro Drop

Summary
Labor market: At first glance, the latest employment report is difficult to interpret. The underlying signal remains noisy, and one month’s data does little to alter the broader macro narrative.
Fed outlook: The balance of risks still favors inflation and price stability over labor market deterioration. Markets appear to be pricing a more hawkish Fed path than the data currently justifies.
Credit: Investment-grade credit spreads remain exceptionally tight, with spreads contributing one of the smallest shares of all-in yields in decades. That leaves investors with limited compensation for macro shocks.
FX: Foreign exchange volatility remains underpriced relative to the evolving macro backdrop. Long volatility continues to look like an attractive asymmetric trade as policy uncertainty and cross-country divergences increase.
Macro
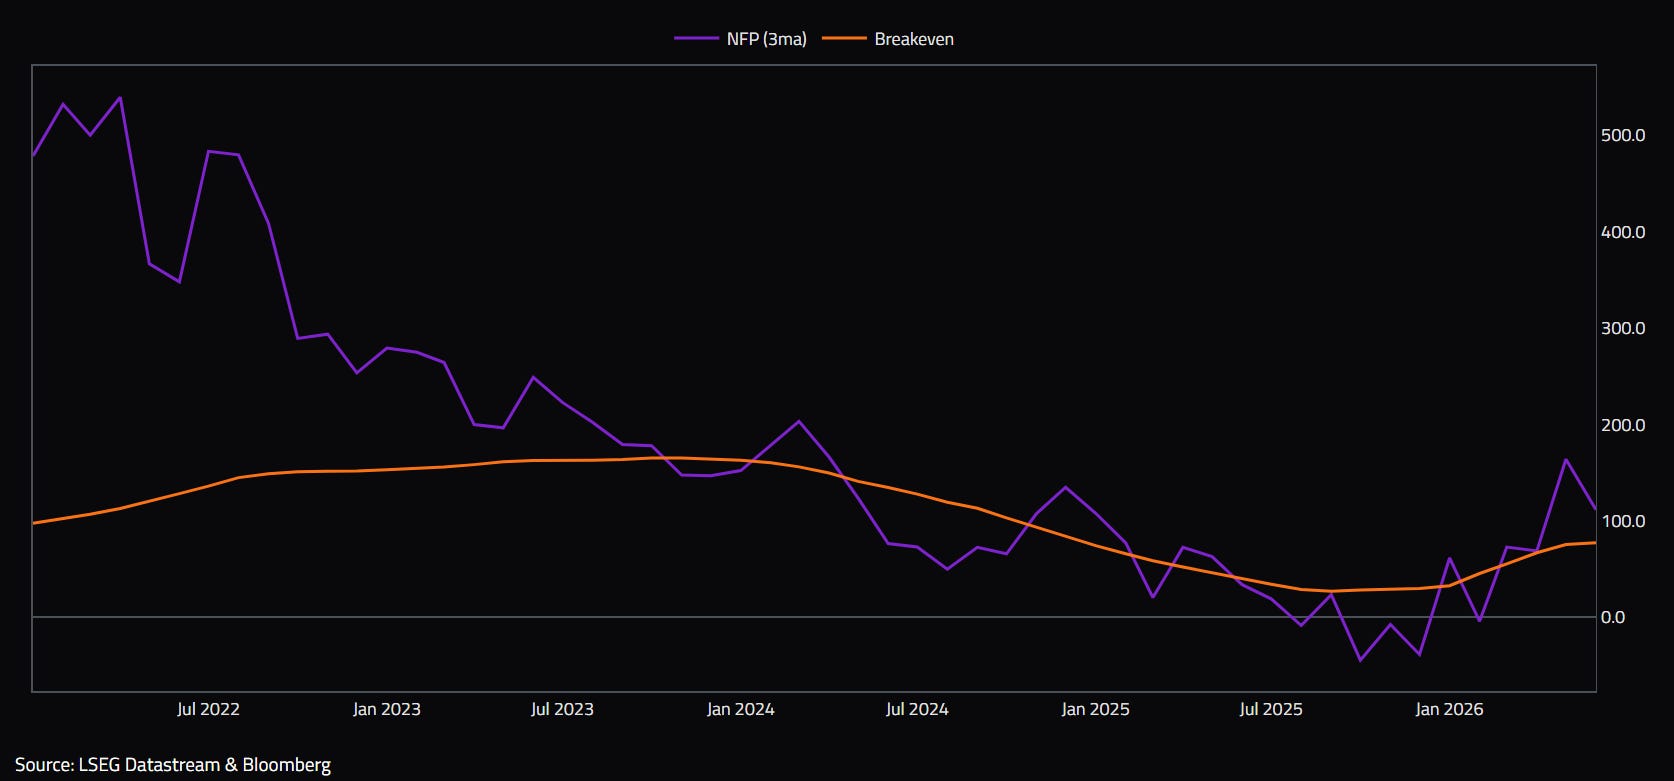
The most recent jobs report was noisy and difficult to interpret. I believe the breakeven level is currently around 70K. Even if it is closer to 50K, that remains low relative to recent trends. The labor market is tightening at the margin, with job growth averaging over 100K over the past three months. It is difficult to see meaningful slack emerging at this point.
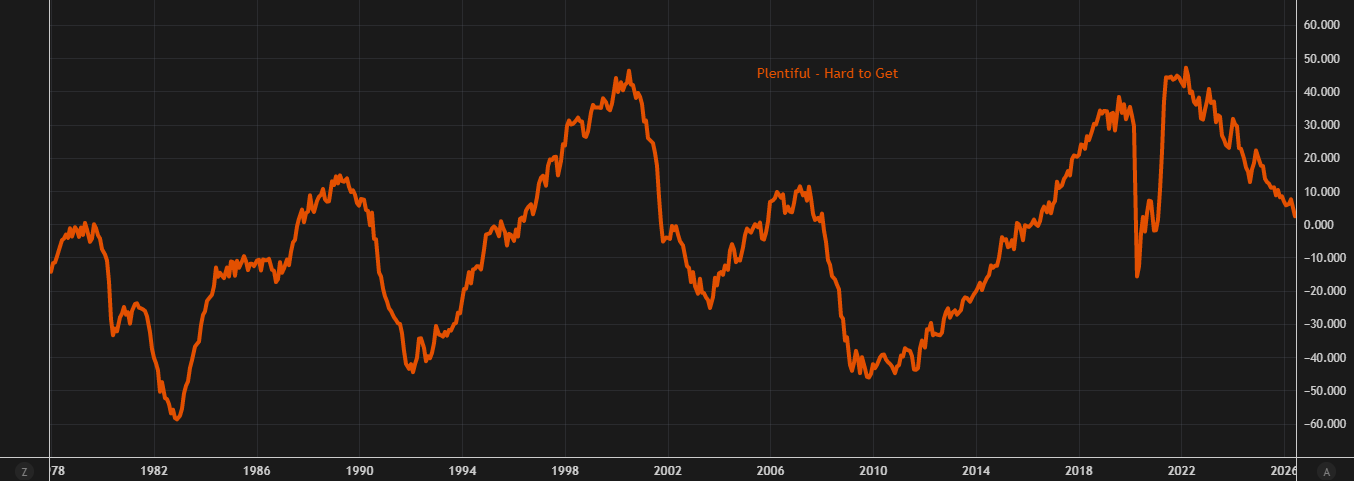
The labor market differential, a closely followed and highly cyclical measure calculated as the gap between respondents saying jobs are "plentiful" and those saying they are "hard to get," declined by 2.6 points to 2.4 in June, marking its weakest reading since February 2021. Perceptions of job availability were largely unchanged, with the share reporting jobs as plentiful edging up 0.1 percentage point to 24.9%. Meanwhile, the proportion of respondents describing jobs as difficult to find increased by 2.7 percentage points to 22.5%, the highest level recorded since January 2021. Looking ahead, expectations for fewer available jobs over the next 12 months eased by 1.4 percentage points to 25.6%, although the measure remains elevated and continues to stay within the narrow range that has persisted over the past year.
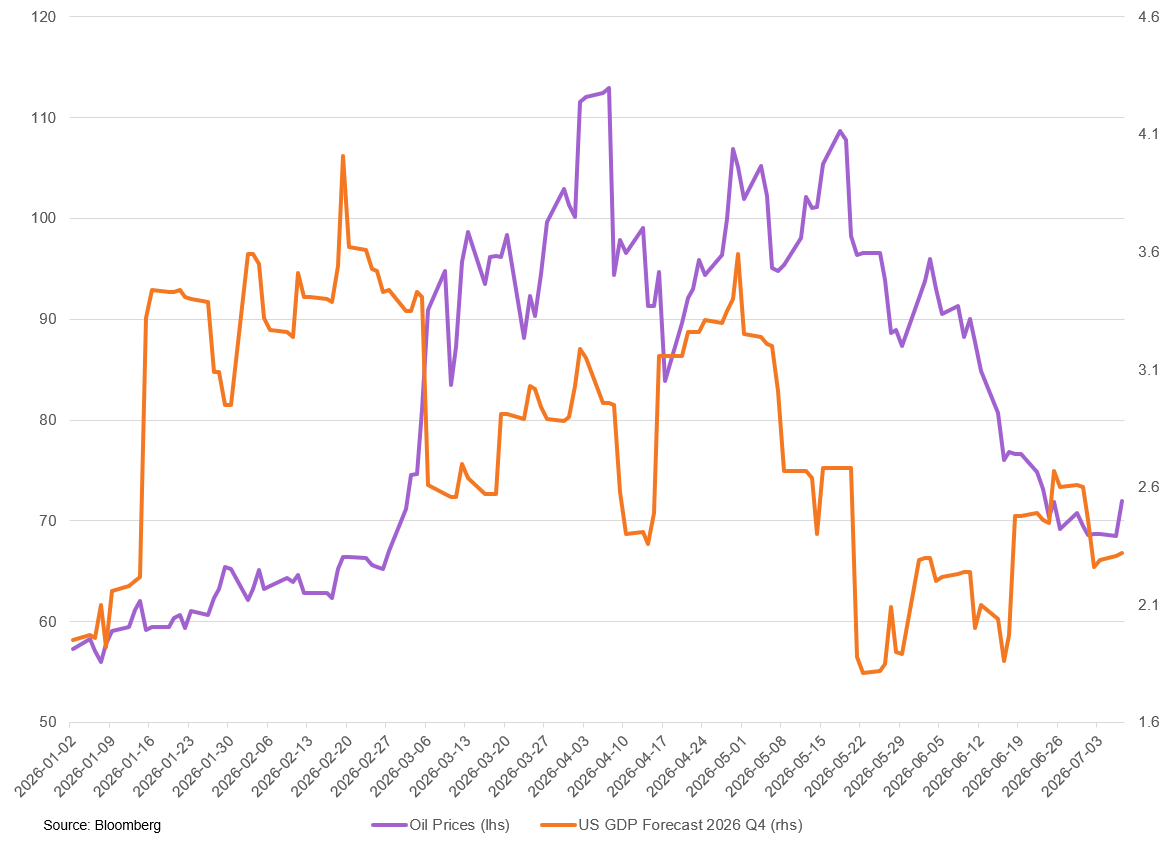
2026 growth expectation upgrades have faded following the increase in energy prices. Fiscal conditions remain loose, and supportive financial conditions have helped mitigate the growth headwinds from the oil shock. We expect a “Goldilocks” scenario, with some narrowing of the output gap and a modest slowdown in consumption due to potentially weaker income growth. This should weigh slightly on growth, but we still expect GDP growth to remain around 2.25%.
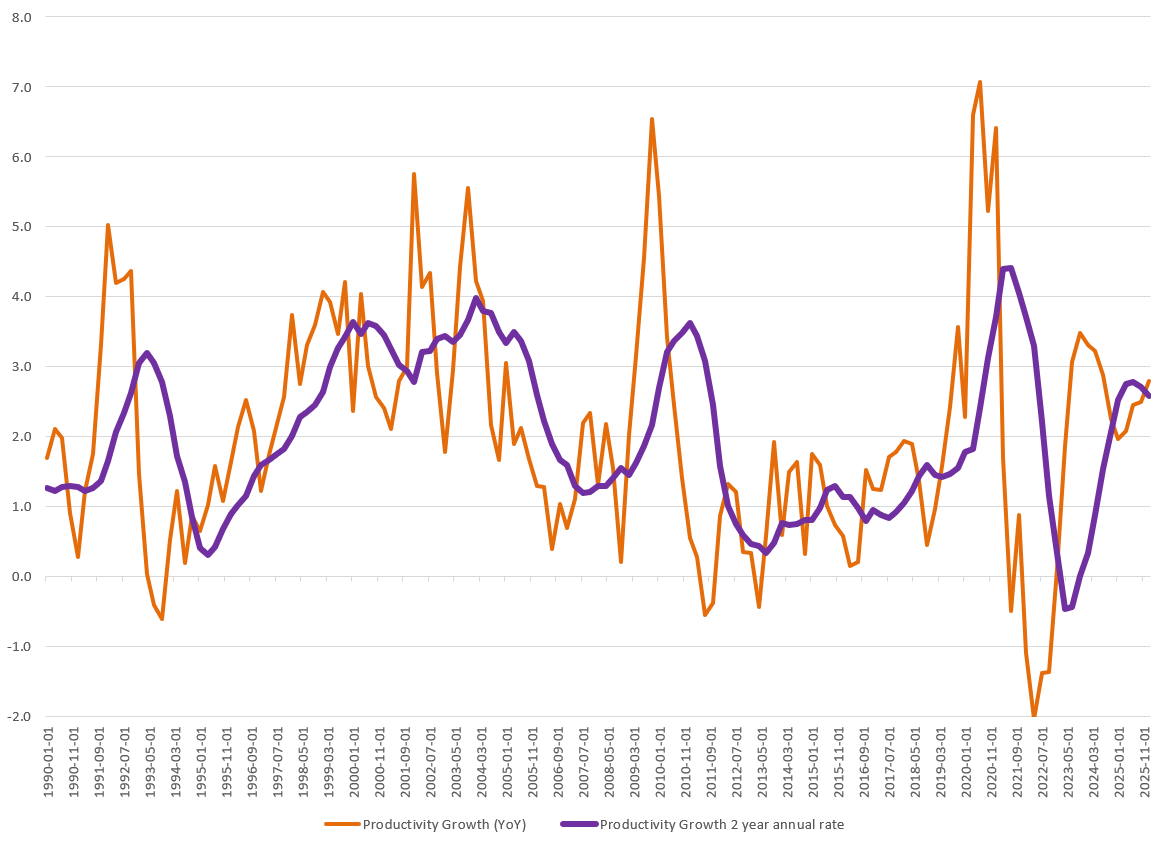
One theme we have continued to highlight is that productivity growth will increasingly be driven by more efficient utilization of capital and a reduced reliance on labor inputs. In the context of the Solow Growth Model, output growth has traditionally been a function of capital accumulation and labor force expansion. Going forward, however, a larger share of growth is likely to come from improvements in the residual component total factor productivity (TFP) reflecting technological innovation, automation, and more efficient production processes.
Recent data support this view, with productivity growth running at roughly twice the average pace observed over the previous decade.
In the Solow Growth Model, the standard production function is:
Y = A × K^α × L^(1−α)
Where:
Y= Total output
A= Total factor productivity (technology, efficiency, innovation, organizational improvements)
K= Capital stock (machines, equipment, software, infrastructure)
L= labor input (workers or hours worked)
U.S. PPI and import price data, along with other domestic producer price measures, have shown a notable increase in the prices of semiconductor-related products, particularly since Q4 2025. While the May data provided some relief in the computer software & accessories and computer peripherals categories, both import price and PPI measures continued to signal elevated inflationary pressures, suggesting that pipeline cost pressures remain in place.
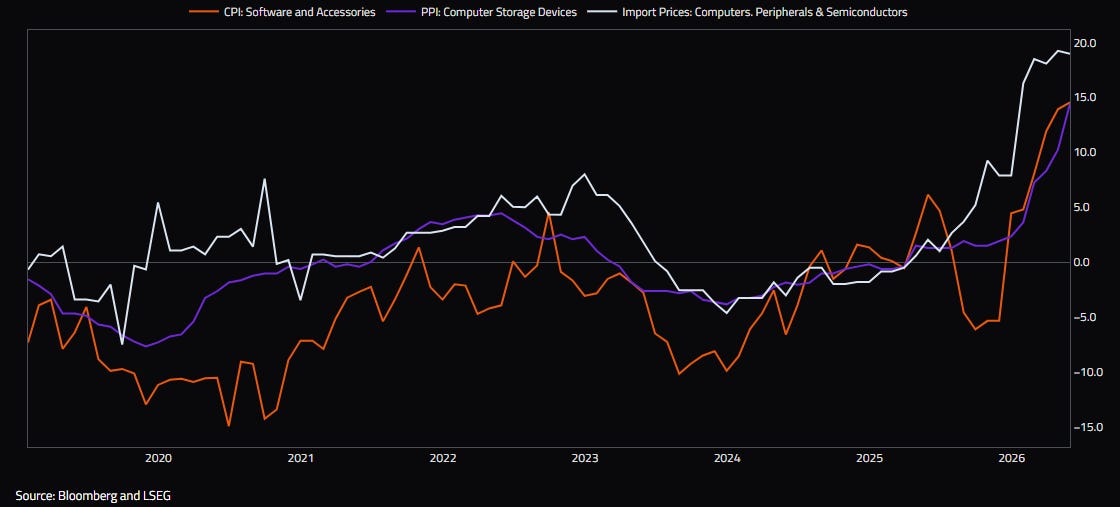
Precisely timing when supply constraints will ease remains difficult. Even as new semiconductor fabrication capacity comes online, demand tied to AI infrastructure, data centers, and accelerated computing continues to expand rapidly, leaving a meaningful backlog that may take time to clear.
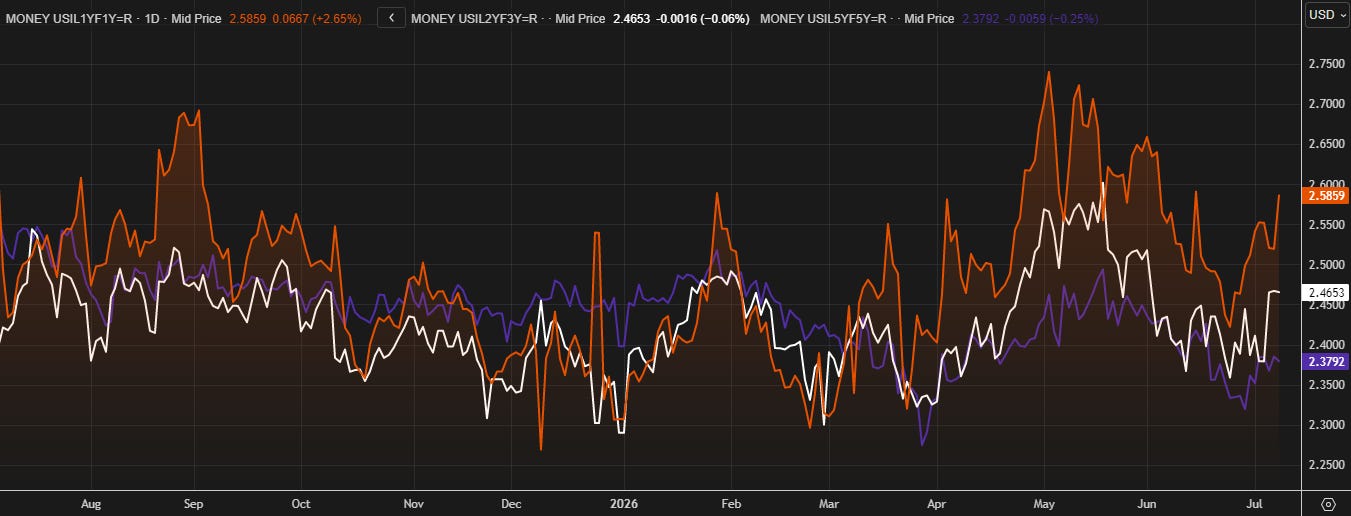
Nevertheless, market-based inflation expectations have recently repriced higher amid renewed geopolitical tensions and the potential for additional energy and supply-chain disruptions.
This dynamic is consistent with the growing view that AI may prove inflationary in the near term but disinflationary over the medium term. As discussed above, AI-sensitive components have already experienced notable price increases, reflecting supply bottlenecks associated with semiconductors, power infrastructure, and compute capacity. Over longer horizons, however, productivity gains, automation, and capital deepening could place downward pressure on unit labor costs and inflation more broadly.
Market pricing has largely reflected this distinction between short- and longer-term inflation risks. Despite the ongoing AI investment boom and rising geopolitical uncertainty, longer-dated inflation expectations have remained relatively stable and have not experienced the same degree of repricing observed in 1y1y and 2y3y inflation swaps. The divergence between front-end and longer-dated inflation expectations is broadly consistent with the view that AI-related supply constraints will eventually ease as productive capacity expands and technological diffusion accelerates.
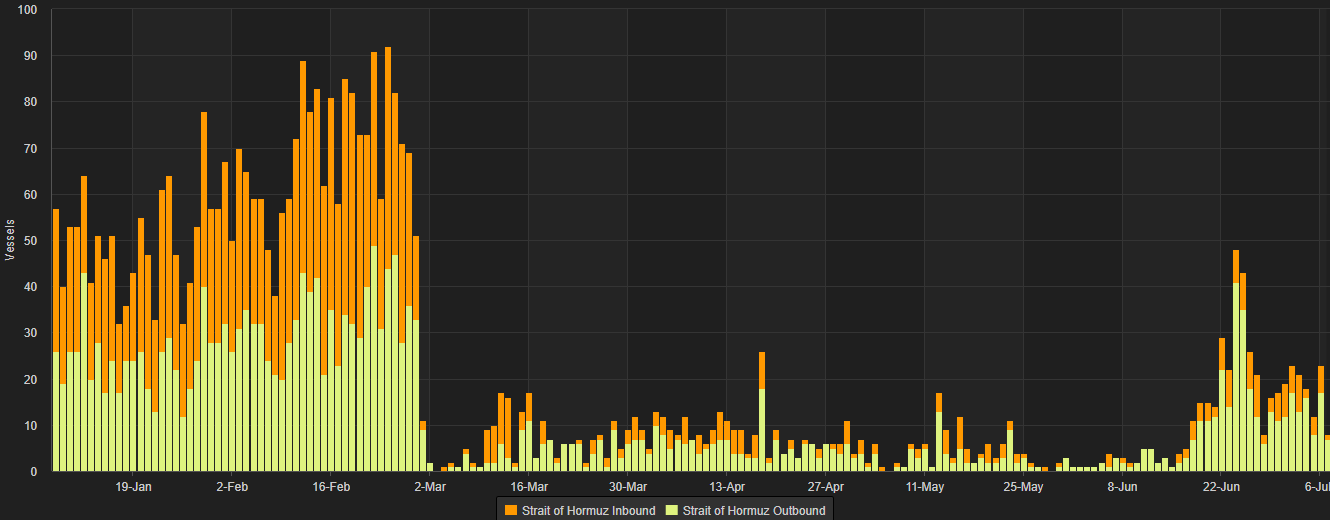
Renewed geopolitical tensions have driven a decline in Strait of Hormuz vessel activity, raising risks of energy price pressures and renewed global supply chain bottlenecks. While the impact on U.S. inflation is likely marginal, prolonged disruptions could create modest upside risks through higher energy and input costs.
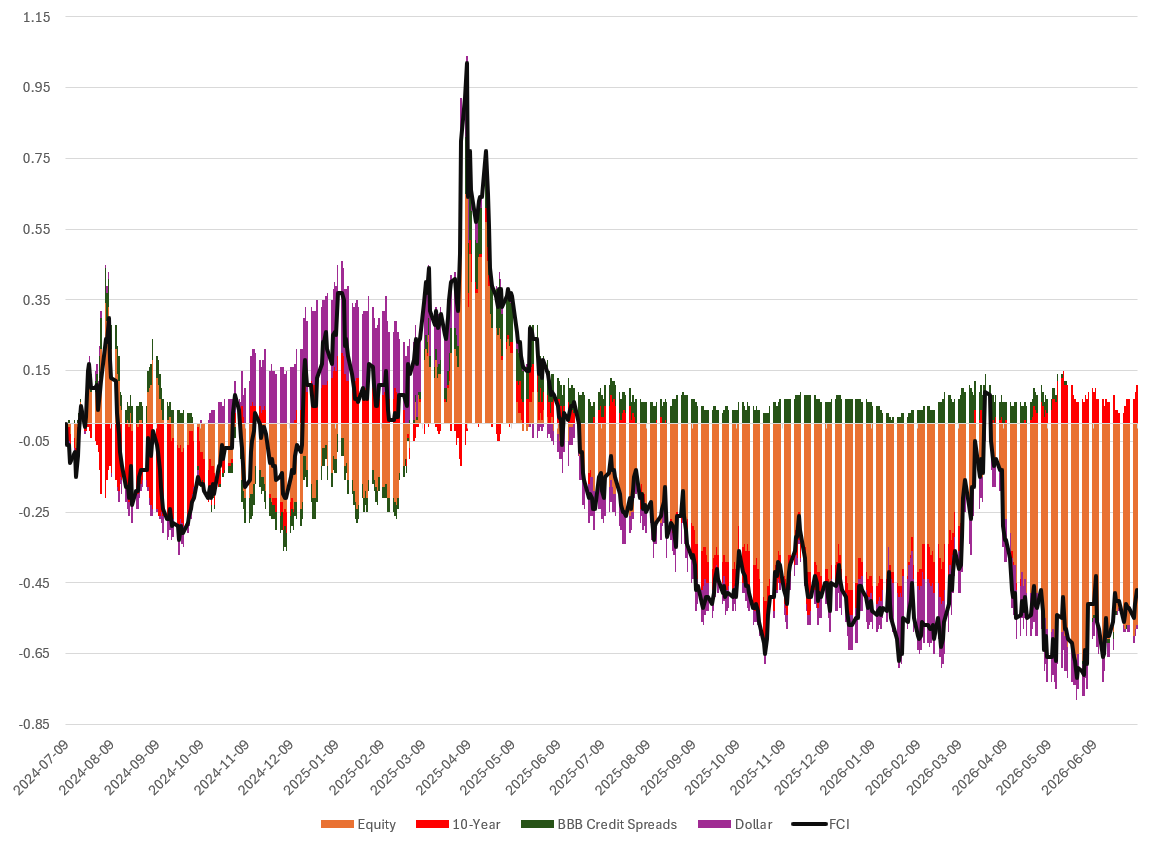
Since the ceasefire announcement, we saw a slight easing (loosening) in financial conditions. Since the renewed geopolitical tensions began, financial conditions have tightened slightly. Thus far, the tightening has been driven primarily by higher 10-year Treasury yields. However, strong equity markets, tighter credit spreads, and a stronger dollar have offset the vast majority of the tightening observed at the beginning of the conflict.
Rates
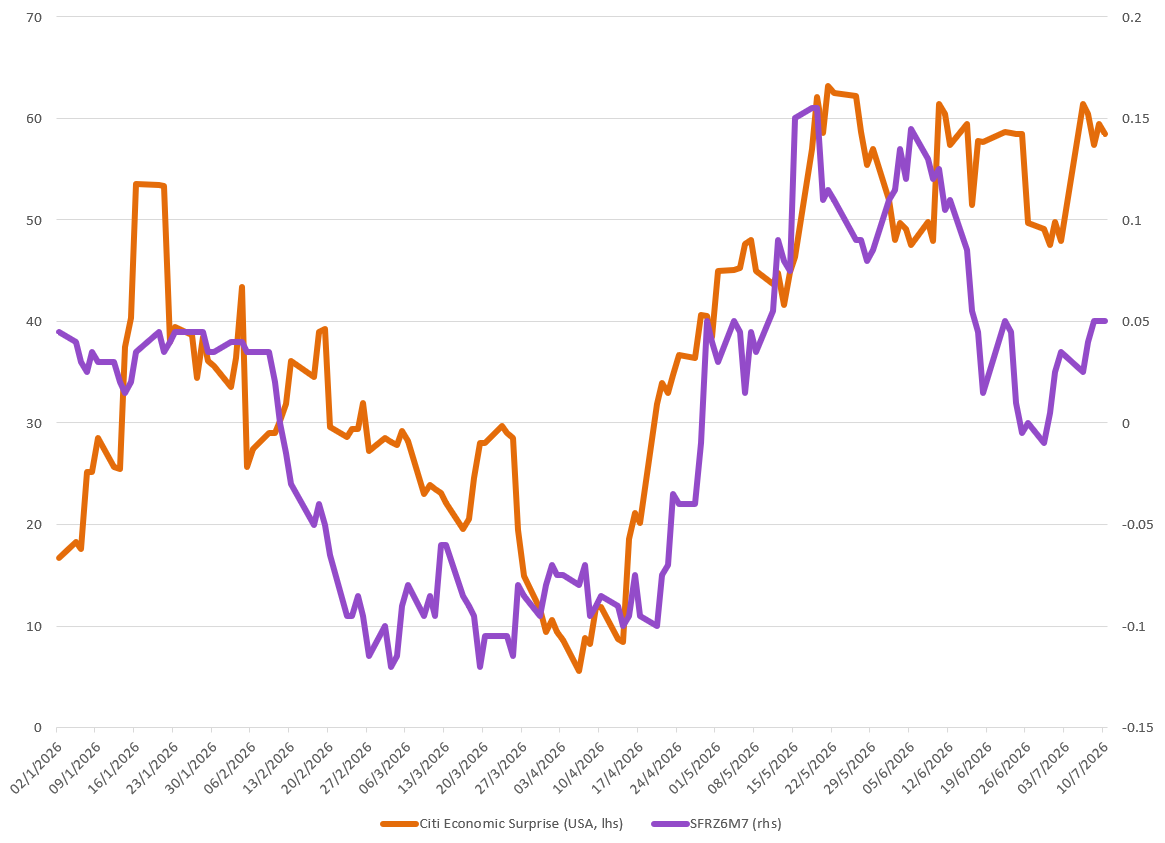
SFRZ6M7 steepeners still look like an attractive trade. The Z6M7 curve flattened following stronger consumer spending and some retracement from May's employment strength, which led to M7 outperforming Z6. Looking at the Citi Economic Surprise Index, despite the noisy jobs report (which, as mentioned above, we are largely looking through), economic surprises continue to skew to the upside. Unless there is a material deterioration in the data and positive surprises begin to fade, steepeners remain an attractive positioning.
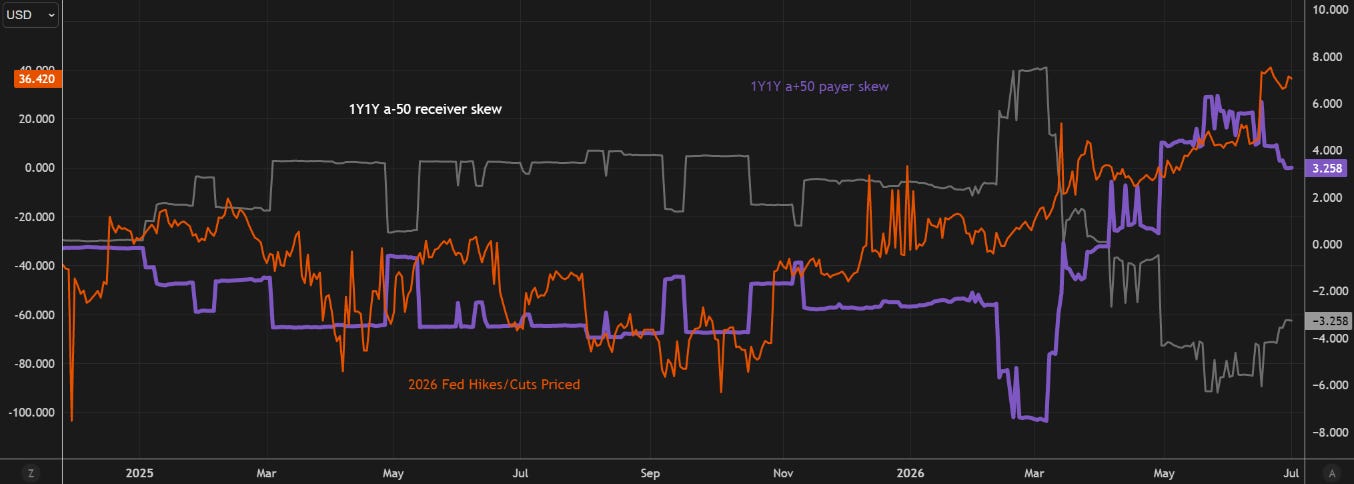
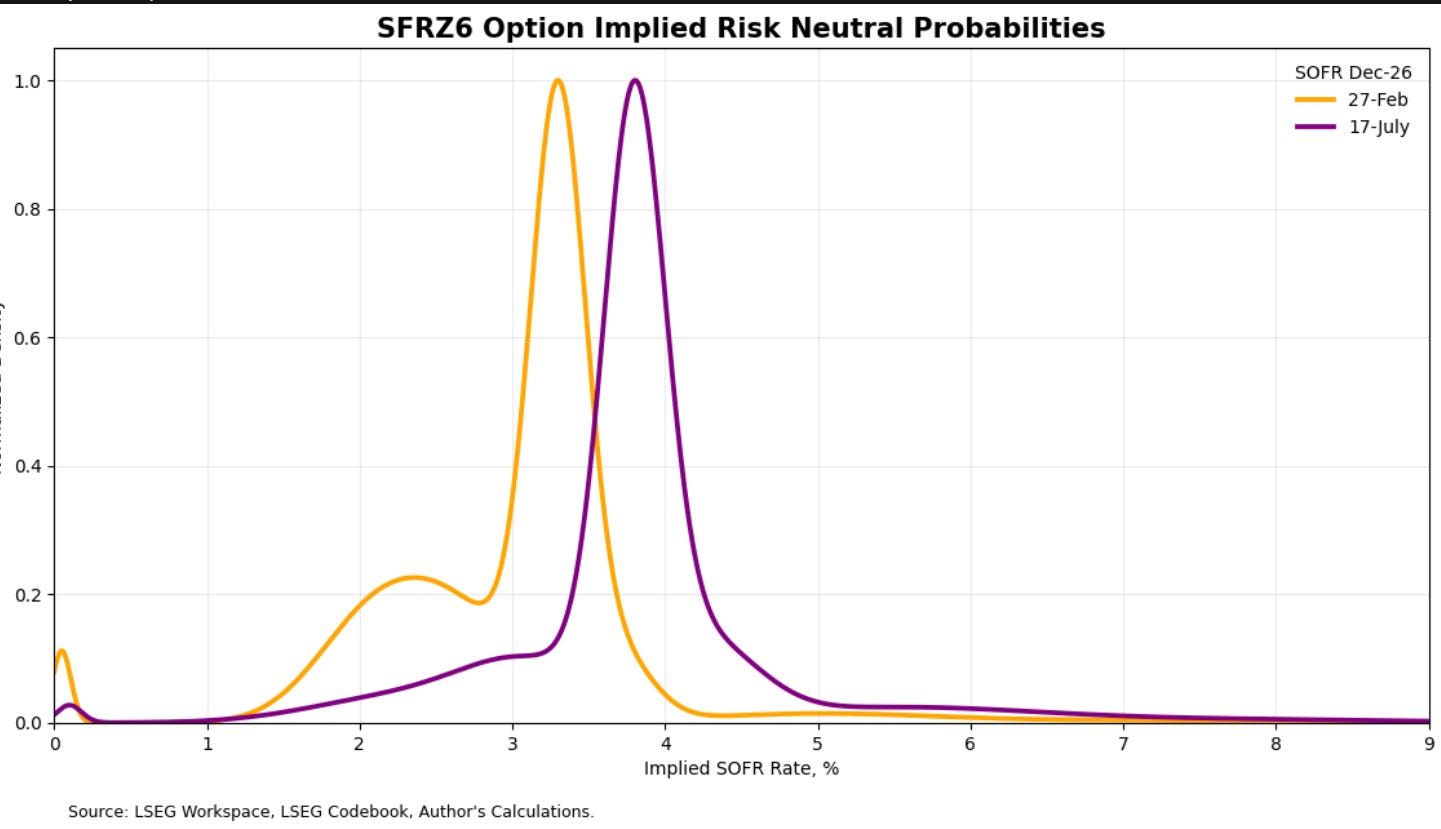
As mentioned in the macro section, the onset of the Middle East conflict led to a richening of payer skew as investors sought high-strike protection. The implied distribution now appears to be priced more hawkishly than what is likely to materialize, suggesting that further richening in payer skew is probably limited.
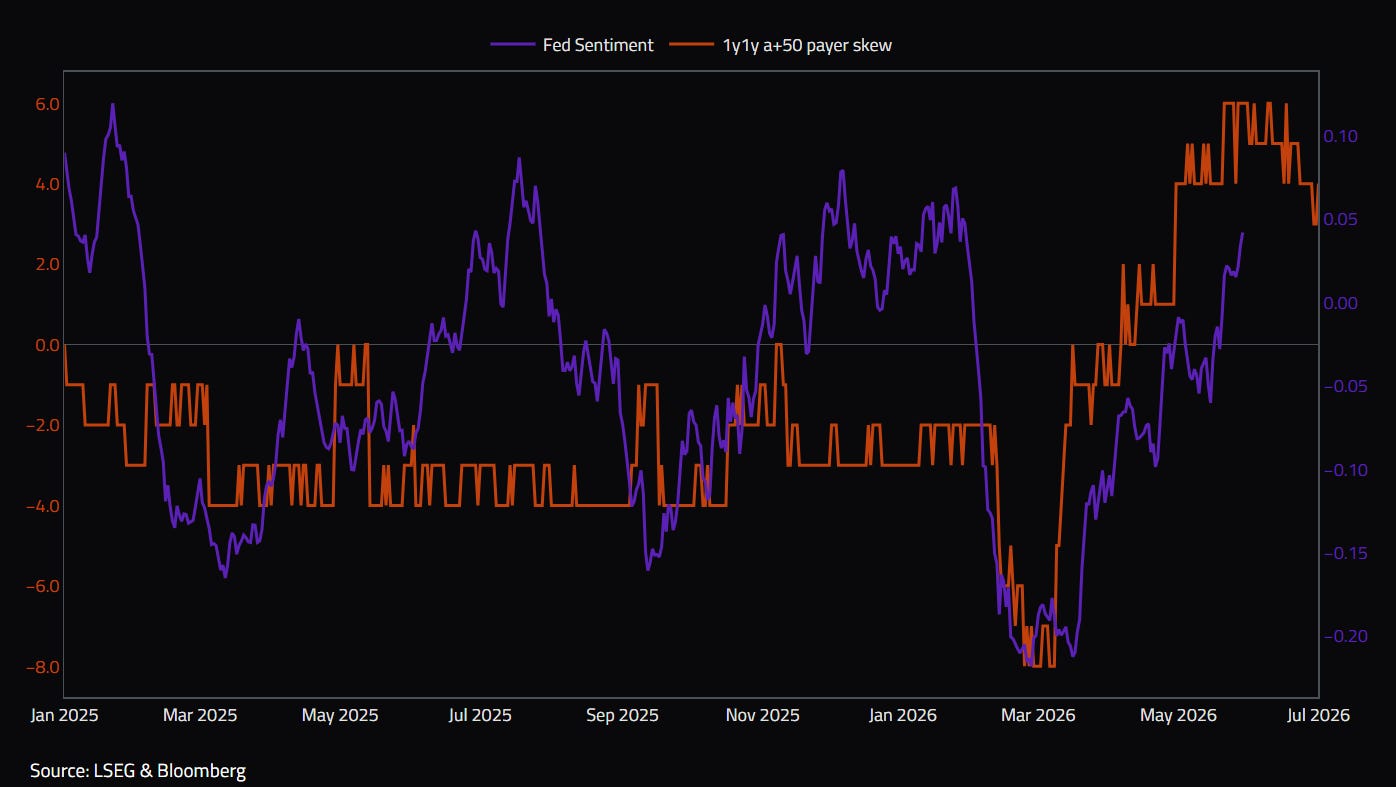
Fed sentiment also turned significantly more hawkish, particularly following the dot plot, where 9 of the 18 participants indicated an expectation of a rate hike. This has contributed to a substantial richening of payer skew. Given that it was Warsh's first meeting as Fed Chair, and that the subsequently released FOMC minutes were slightly more dovish, we could begin to see skew shift, with a modest richening of receiver skew.
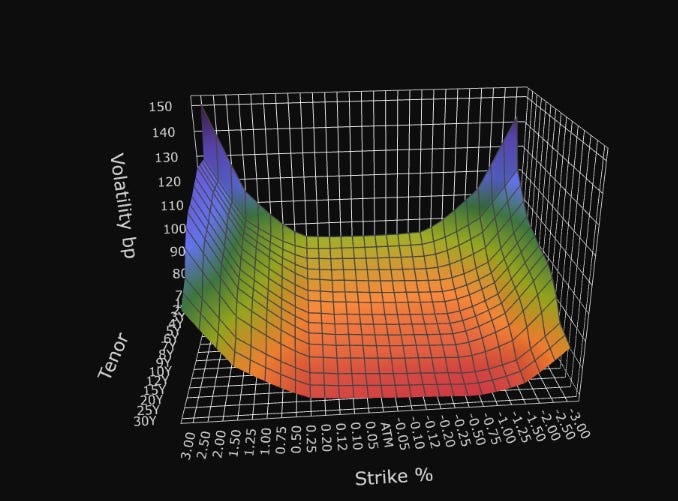
1Y tenor swaptions implied volatility on high-strike payers remains elevated relative to low-strike receivers, with richer payer skew indicating the market is placing greater weight on right-tail rate risks than left-tail risks.
Markets are currently pricing in a rate hike this year. However, unless inflation rises above 5%, the inflation trajectory appears likely to move lower toward year-end. The effects of tariffs have largely dissipated, energy price pressures have broadly eased and are likely to remain range-bound between $75 and $80, shelter disinflation is continuing, and some softening in aggregate demand is emerging. Taken together, these factors suggest that the probability of the Fed holding rates is higher than the probability of another hike.
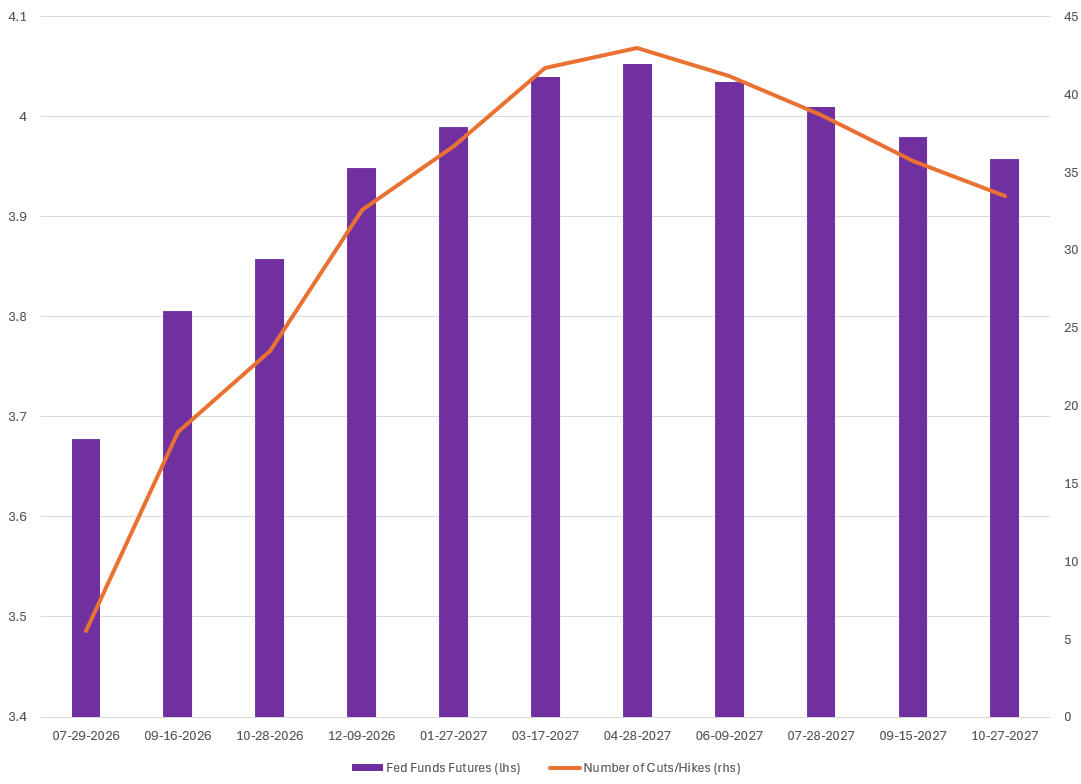
A normalization of the policy rate toward the effective federal funds rate over the coming months would likely support a steeper Treasury yield curve. Given the uncertainty around the timing of this adjustment, positioning in curve steepeners with favorable carry and roll characteristics is preferable. The belly of the curve, particularly around seven years, offers relatively attractive carry and roll dynamics, while the long end provides less favorable carry. Recent curve flattening has also improved the entry point for steepening trades. The main downside risk to this view would be stronger-than-expected inflation or continued labor market resilience, both of which could delay policy easing and keep the curve flatter for longer.
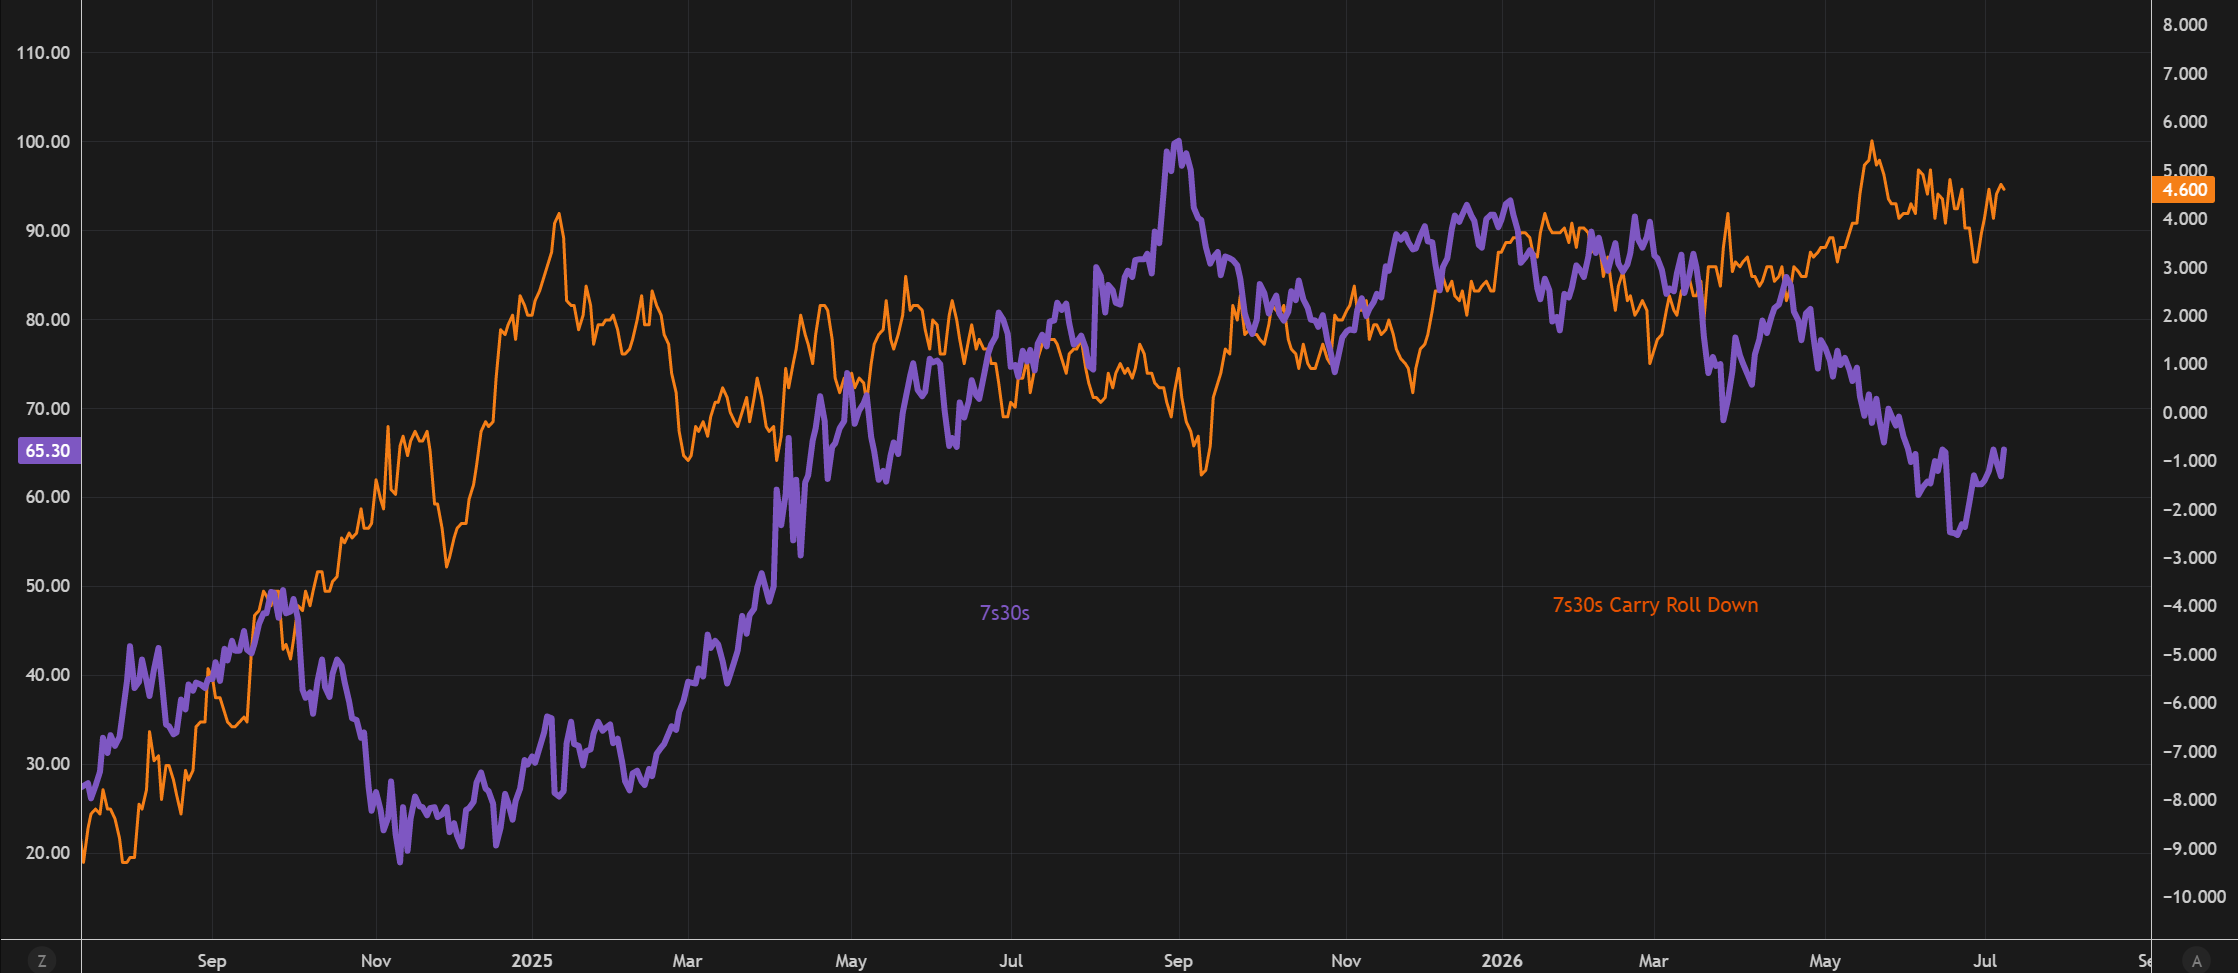
As mentioned, the potential for a more dovish pivot from the Fed creates an interesting comparison with the last energy shock (Russia-Ukraine), which coincided with the Fed raising rates much more rapidly than expectations. The current environment presents an interesting contrast, given the potential for a dovish pivot while the market still prices in the possibility of further rate hikes due to inflation risks outweighing growth concerns. The broader takeaway is that markets often misprice the actual path of both upside and downside risks.
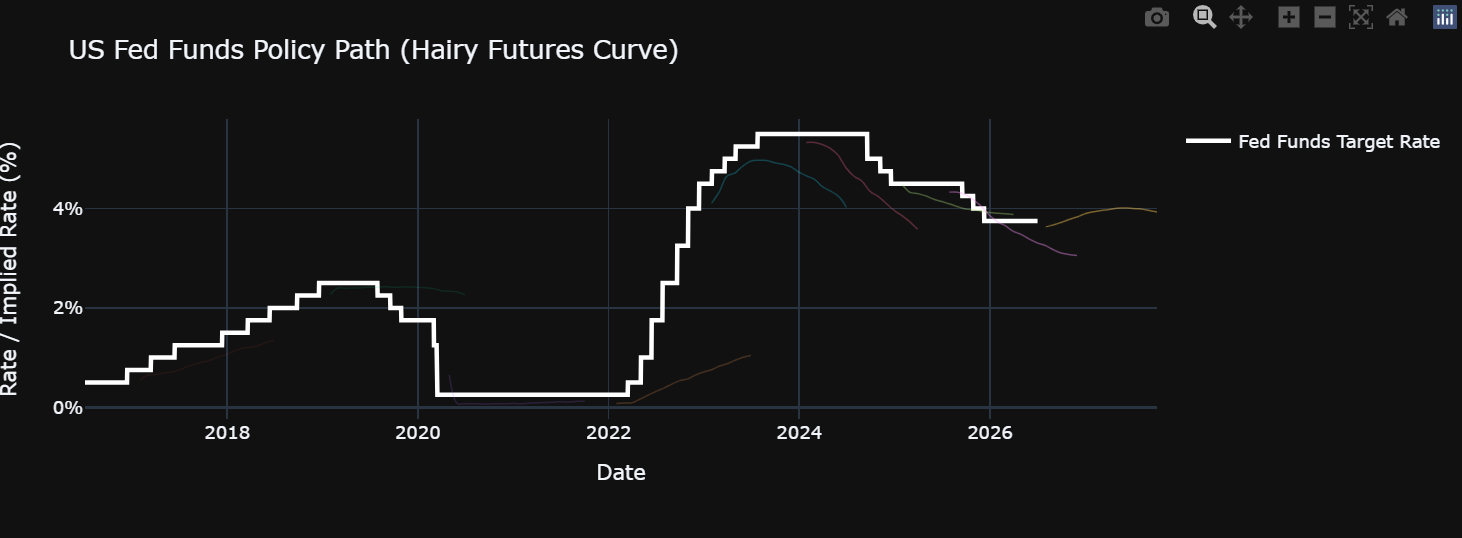
We favor a 30Y–5Y UST flattener as the most attractive expression of our curve view. The segment remains elevated relative to the levels seen during the 2022–2024 tightening cycle, leaving room for further compression as policy expectations normalize and inflation remains contained.
The main risk to the trade is a renewed deterioration in labor data that drives a dovish repricing and a bull steepening of the curve. Conversely, a sustained rise in term premium from fiscal or supply concerns could push the curve steeper, although we view these risks as limited in the near term given the lack of immediate changes to Treasury issuance strategy or Fed balance sheet policy.

Overall, the 30Y–5Y sector has a more attractive profile than front-end flatteners, where near-term rate hike pricing creates a larger headwind.
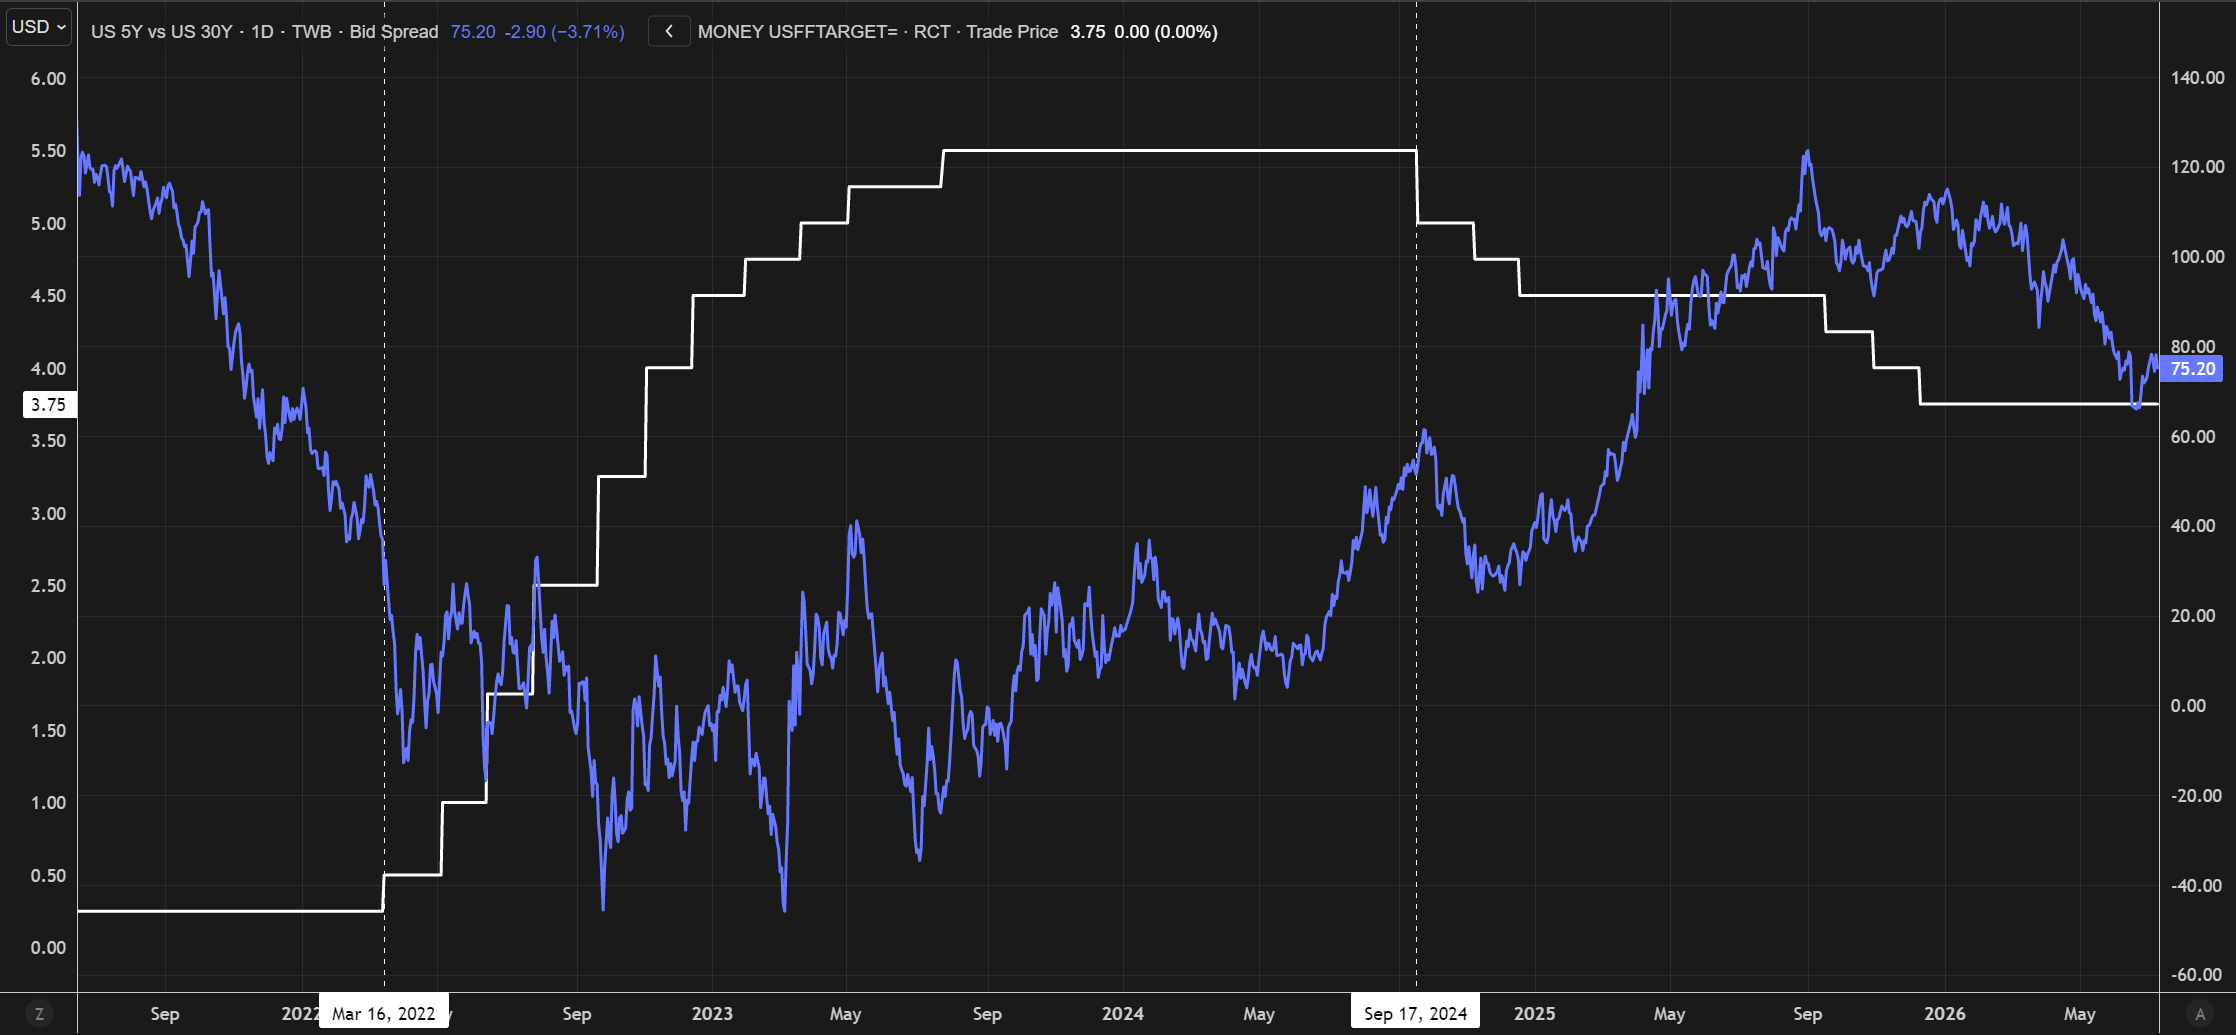
While our central expectation is for the Fed to remain on hold through 2026 and 2027, the risks around this outlook are increasingly asymmetric toward further tightening. SOFR options continue to reflect a meaningful probability of rate hikes, suggesting markets are assigning greater weight to upside inflation risks despite the recent US-Iran MOU.
If the Fed were to deliver a hike, investors may view it as the beginning of a broader policy adjustment rather than a one-off move. As a result, front-end rates could remain biased higher, even in the absence of an immediate change in policy, particularly in an environment where the Fed provides less explicit forward guidance under Chair Warsh.
Credit
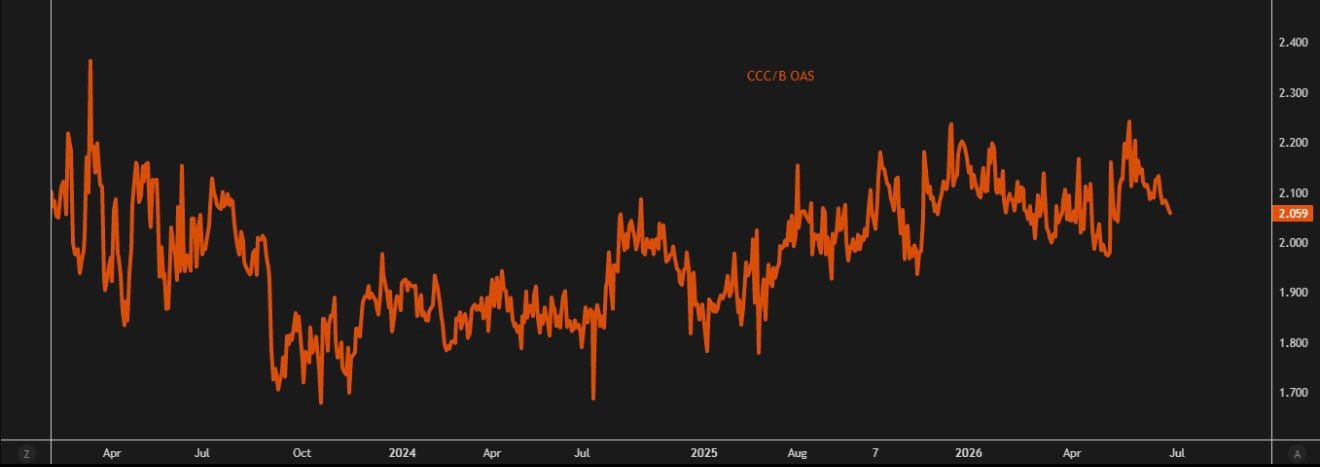
CCCs have recovered some of their recent underperformance. The earlier widening was driven by idiosyncratic repricing, and we are not seeing a meaningful increase in deeply distressed bonds within the CCC cohort. We believe there are still opportunities to be found in CCCs.
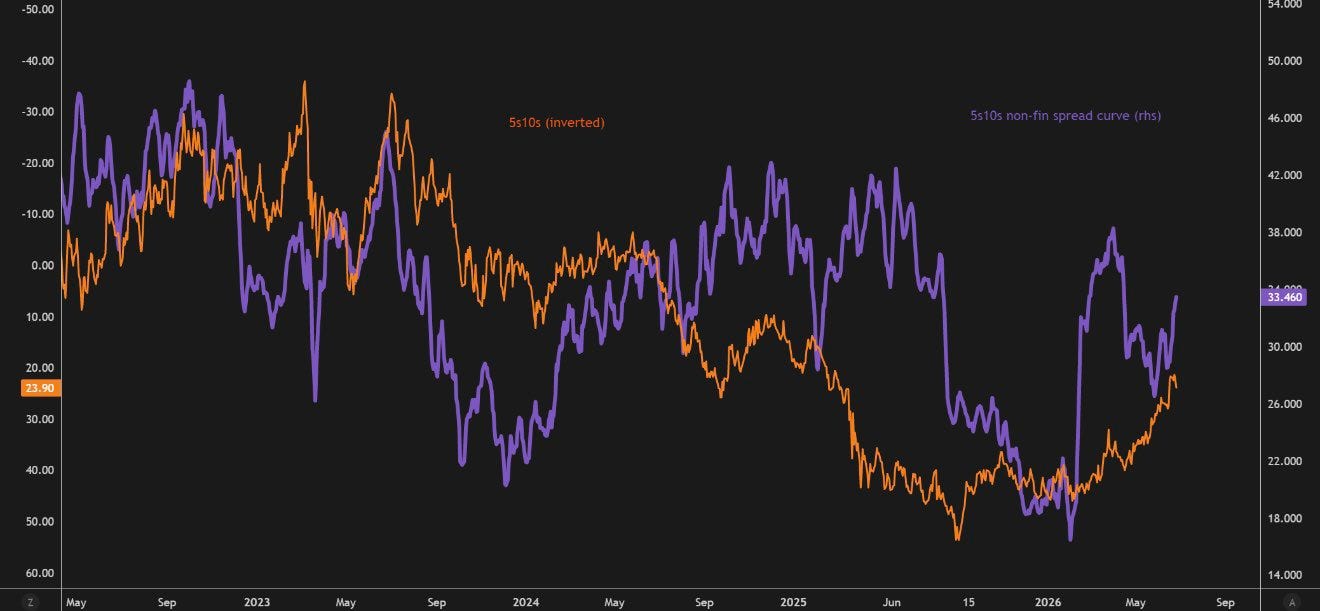
Despite a flatter Treasury curve, the long end has remained resilient due to constrained 30Y supply and strong demand. Softer demand for 10Y Treasuries has driven a steeper 5s10s curve, leaving 10Y spreads near multi-year cheap levels.
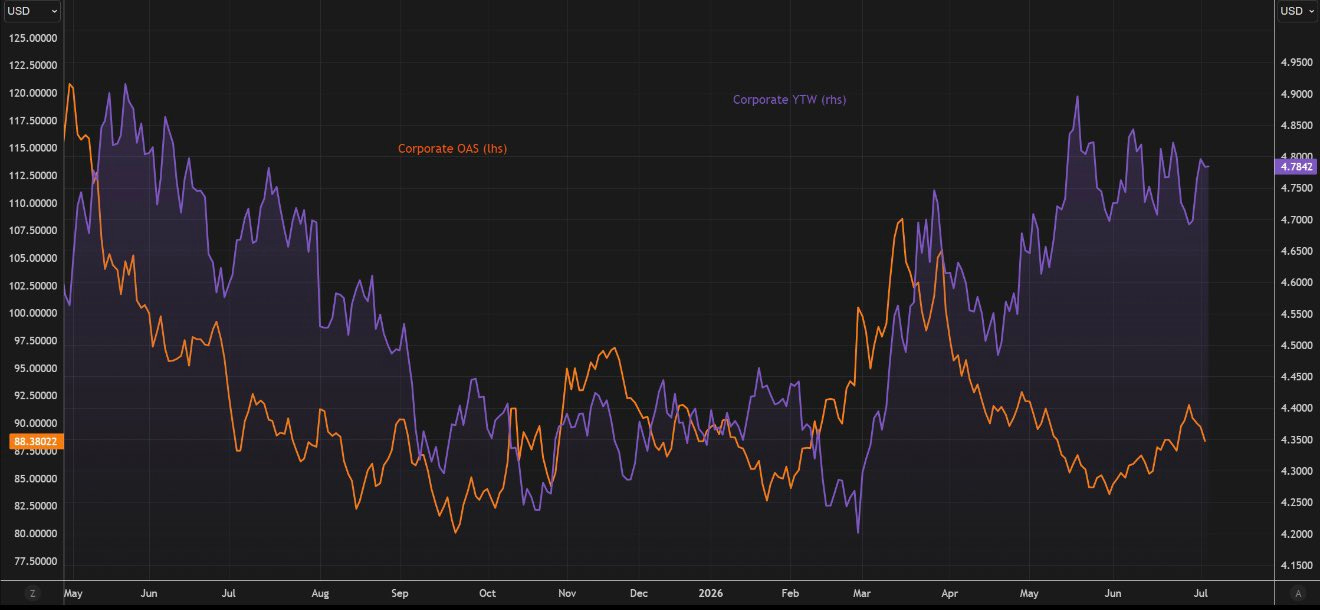
Yield demand and healthy fundamentals continue to support IG credit, keeping spreads near cycle tights. However, with IG spreads contributing the smallest share of all-in yields in decades, investors are receiving limited compensation for risk, leaving spreads increasingly vulnerable to macro shocks.
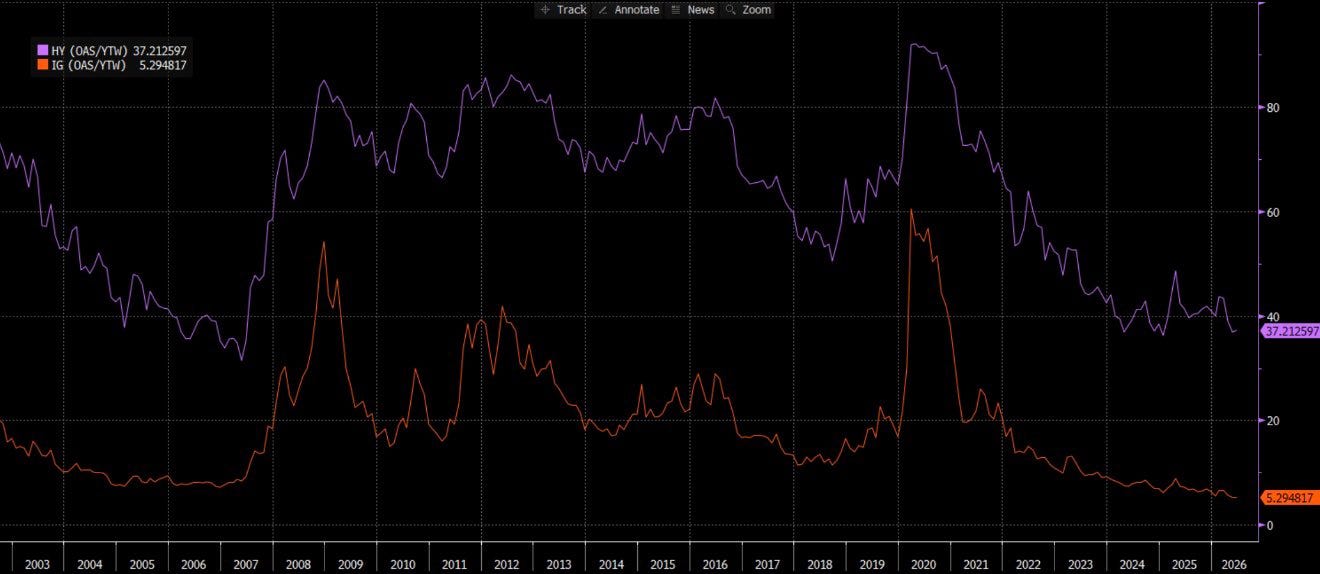
However, with IG spreads contributing the smallest share of all-in yields in decades, investors are receiving less compensation for incremental credit risk, leaving spreads more vulnerable to macro shocks (as shown in the Bloomberg graph above). That said, corporate credit remains supported by all-in yields above 5%, with elevated carry providing a buffer against spread widening. Resilient fundamentals and strong demand continue to provide a favorable technical backdrop, although the margin of safety from spreads remains limited.
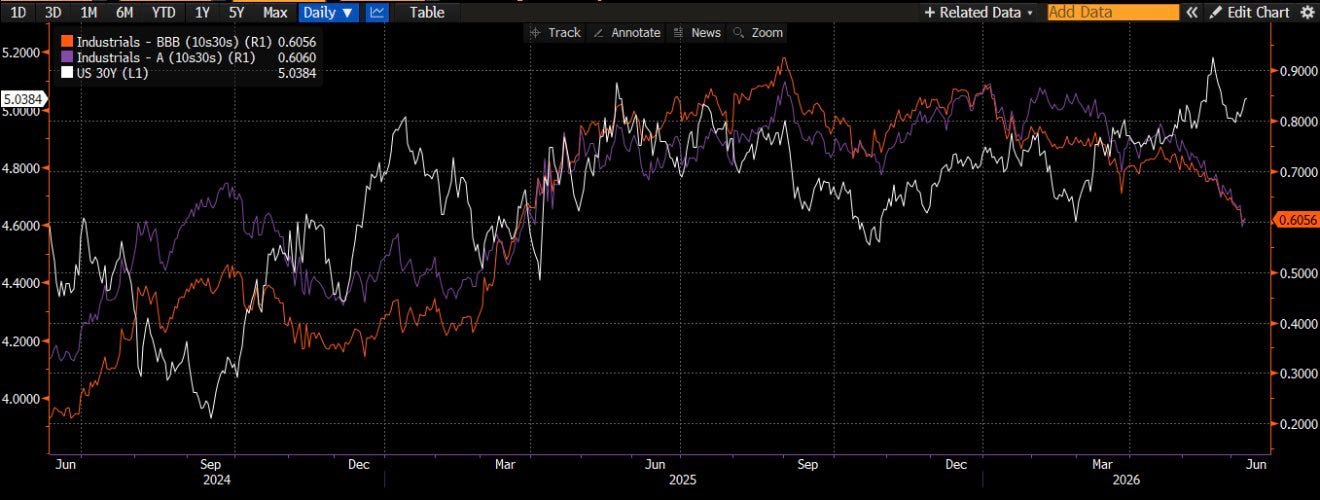
Investors are reaching for all-in yield, driving a flattening of long-end credit spread curves, most notably among higher-quality issuers.
Heavy long-end supply initially steepened 10s30s curves, but demand for high-grade duration has since compressed spreads, with single-A industrials experiencing the strongest flattening.
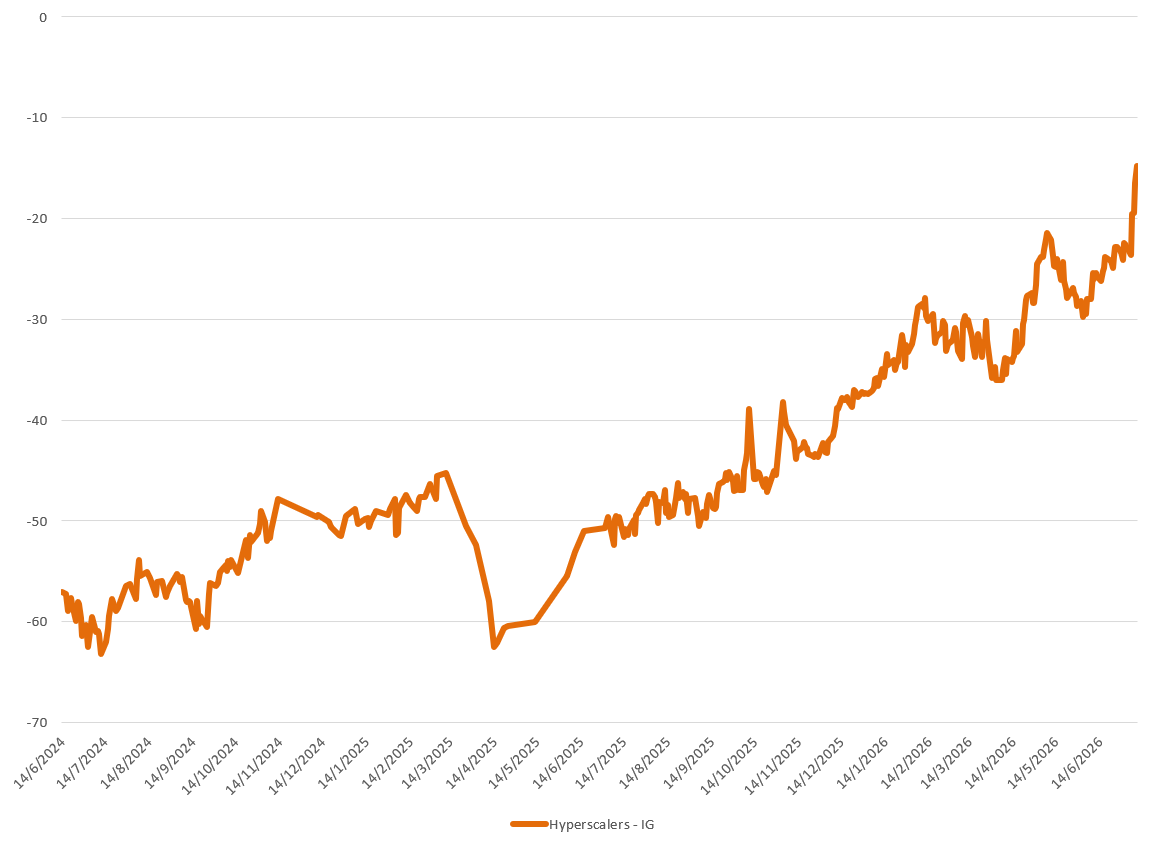
Hyperscaler credit has been pressured by a wave of new issuance, which has created a meaningful supply overhang. As a result, spreads have widened relative to the broader IG universe, with the sector lagging by approximately 40bp since the middle of last year, excluding ORCL.
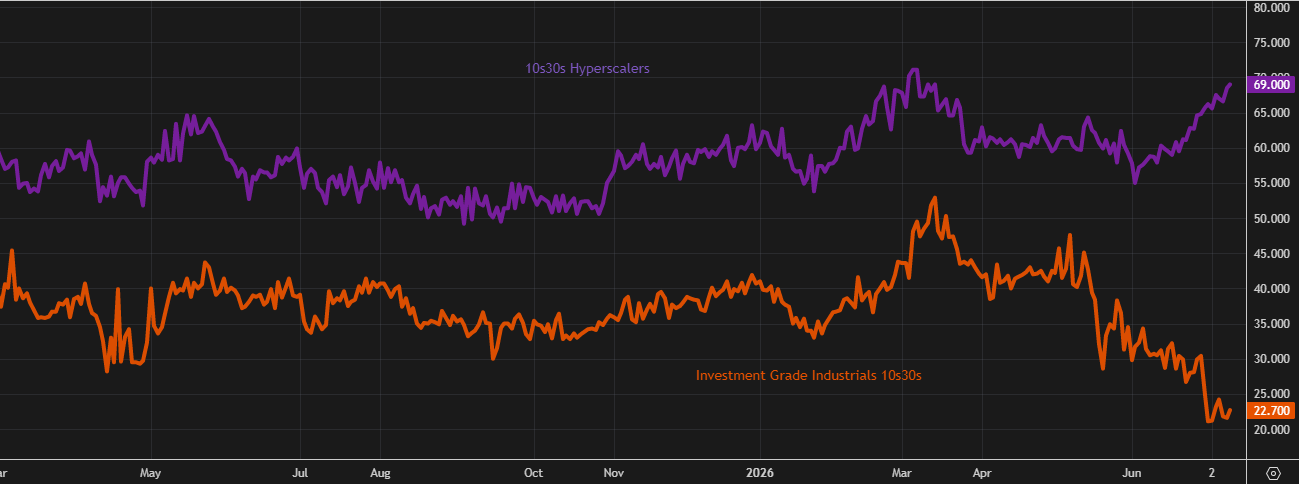
The impact of supply has been particularly pronounced in longer-dated bonds, leading to a steepening bias in hyperscaler curves. Unlike the broader industrial universe, where 10s30s curves have flattened since May, hyperscaler curves have steepened since September.
Historically, spread widening has tended to occur alongside curve flattening, making the current divergence notable. The combination of wider spreads and steeper curves suggests that hyperscaler issuance dynamics are creating pressure across both the sector’s spread profile and maturity structure.
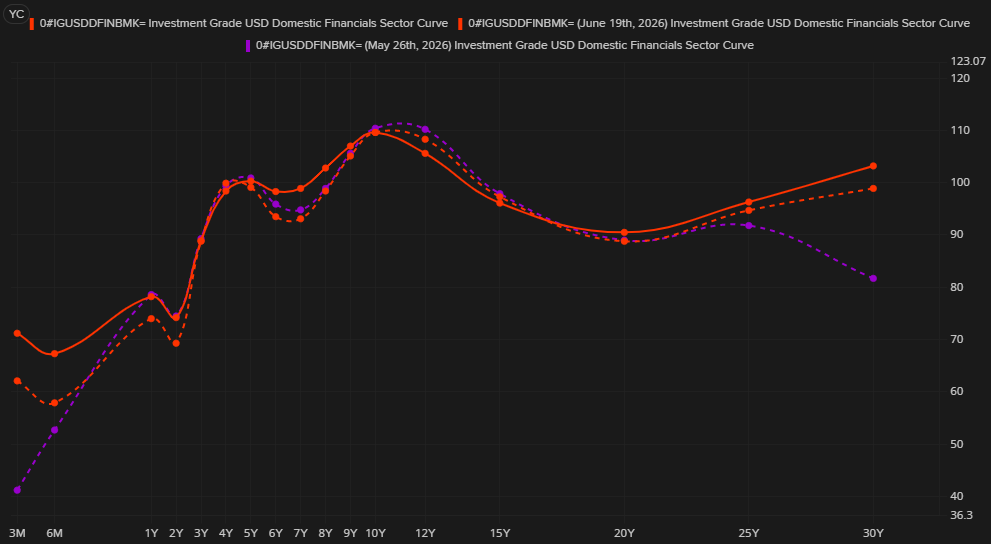
The Financials curve cheapened modestly this week, driven primarily by widening in the front end and belly of the curve. Spreads moved wider by approximately 5bp across short- and intermediate-dated maturities, while longer tenors remained relatively contained. Despite the broader move wider, the curve shape was largely unchanged, suggesting limited repricing of long-end risk.
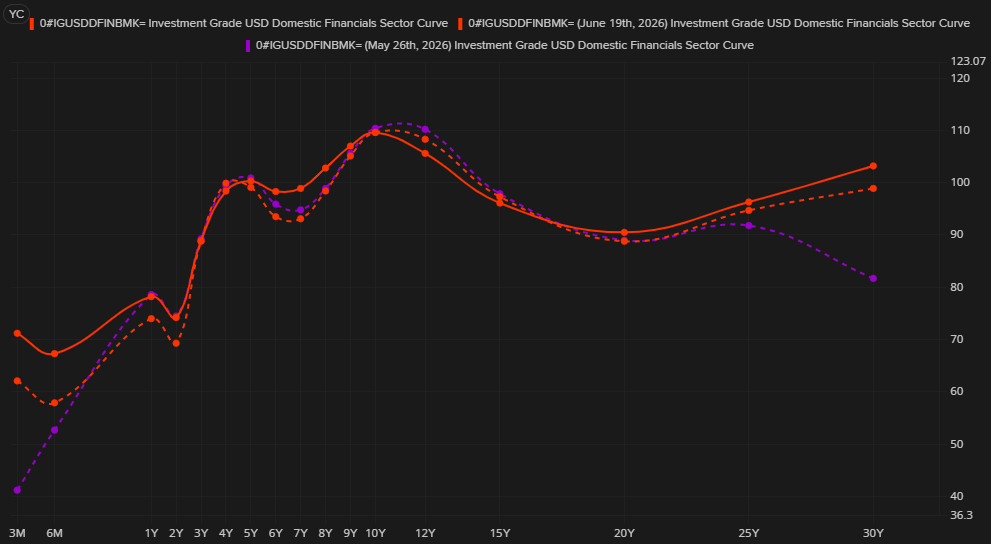
Investment-grade spreads were largely unchanged this week, with modest widening across most maturities. The move was relatively contained, as spreads generally shifted by only 1–3bp, while intermediate and longer maturities remained range-bound. The curve shape was broadly stable.
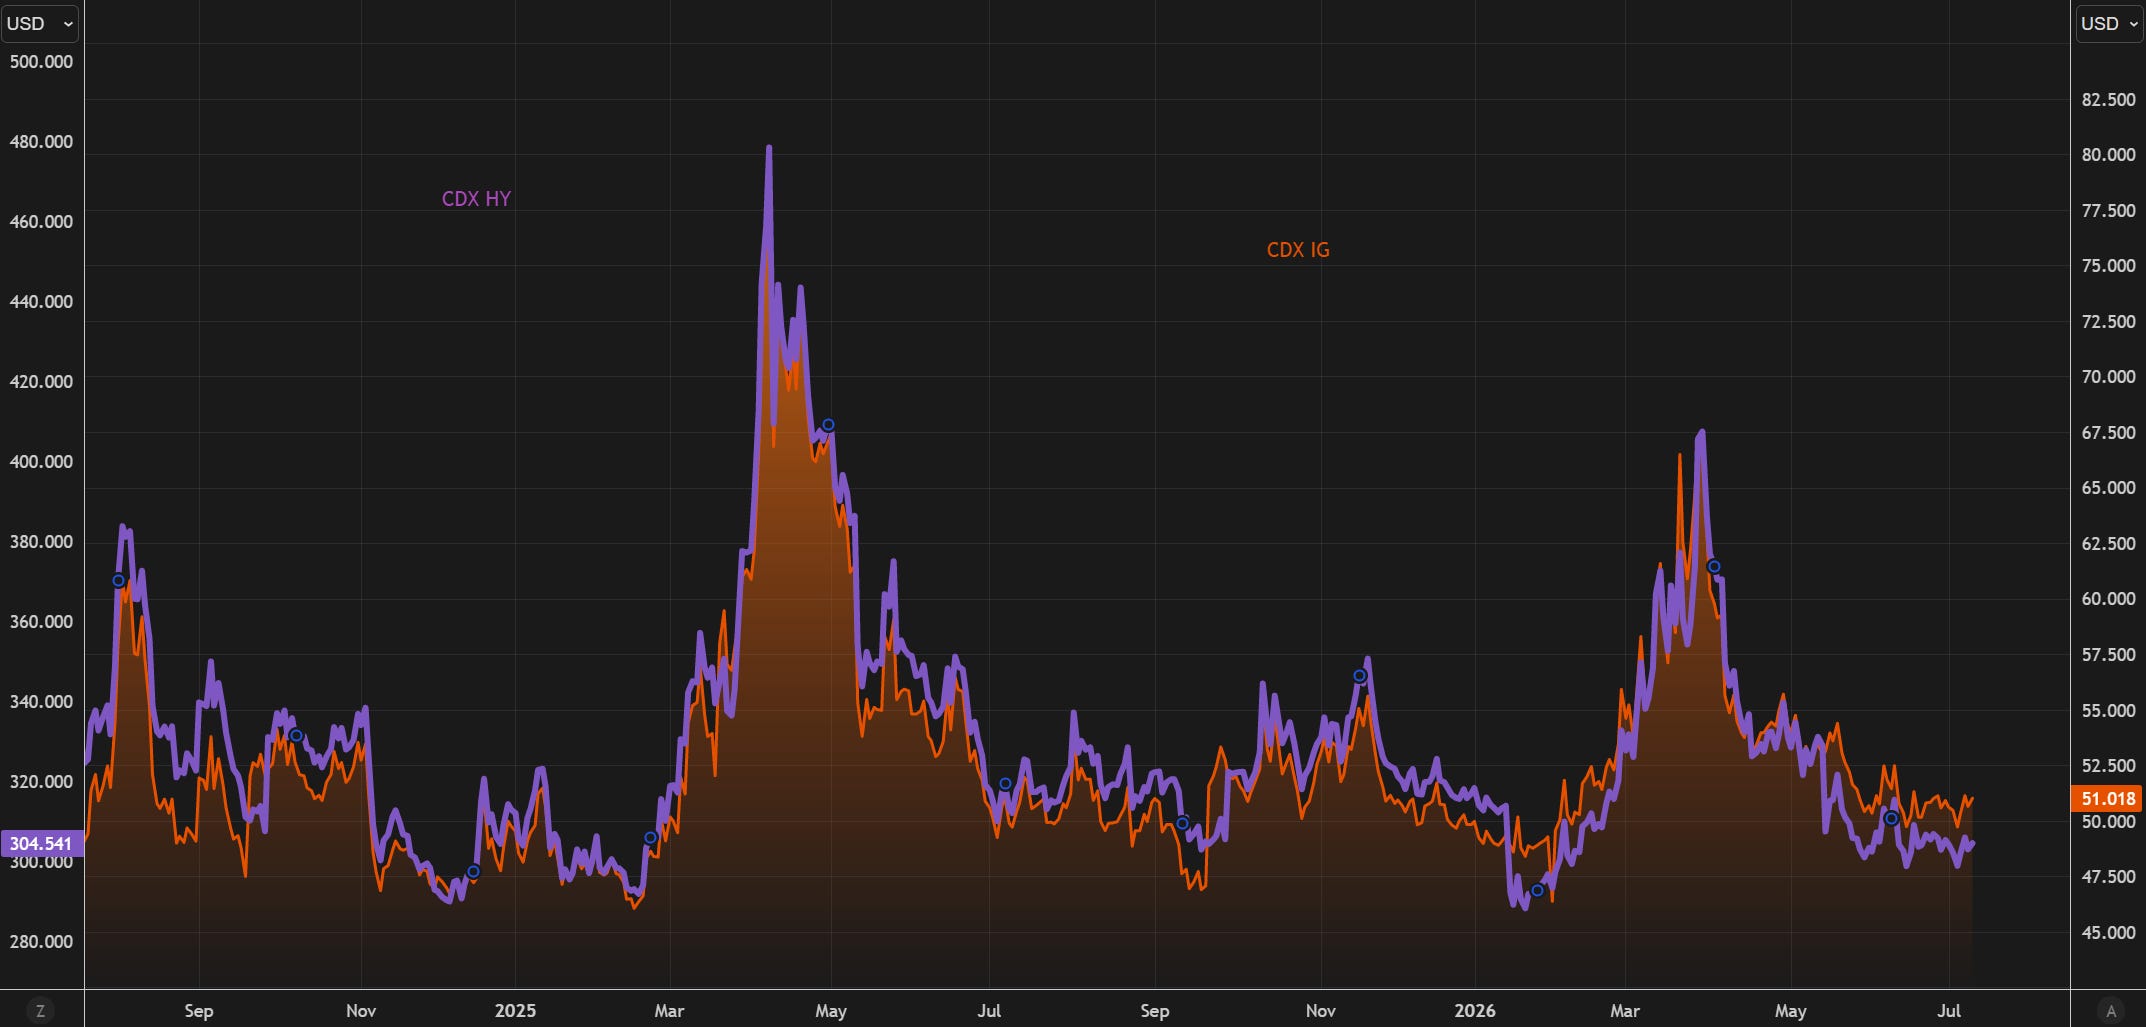
CDX indices were largely stable this week, with IG trading in a narrow range around and HY trading within a similarly tight range. Credit markets have recovered the widening experienced during the Middle East conflict, with current series now trading tighter than earlier-year levels.
The indices have since entered a consolidation phase, reflecting limited room for further tightening given already compressed valuations. While we do not expect a significant rally from current levels, spreads could continue to grind tighter gradually if risk sentiment remains supported and no new geopolitical catalysts emerge.
FX
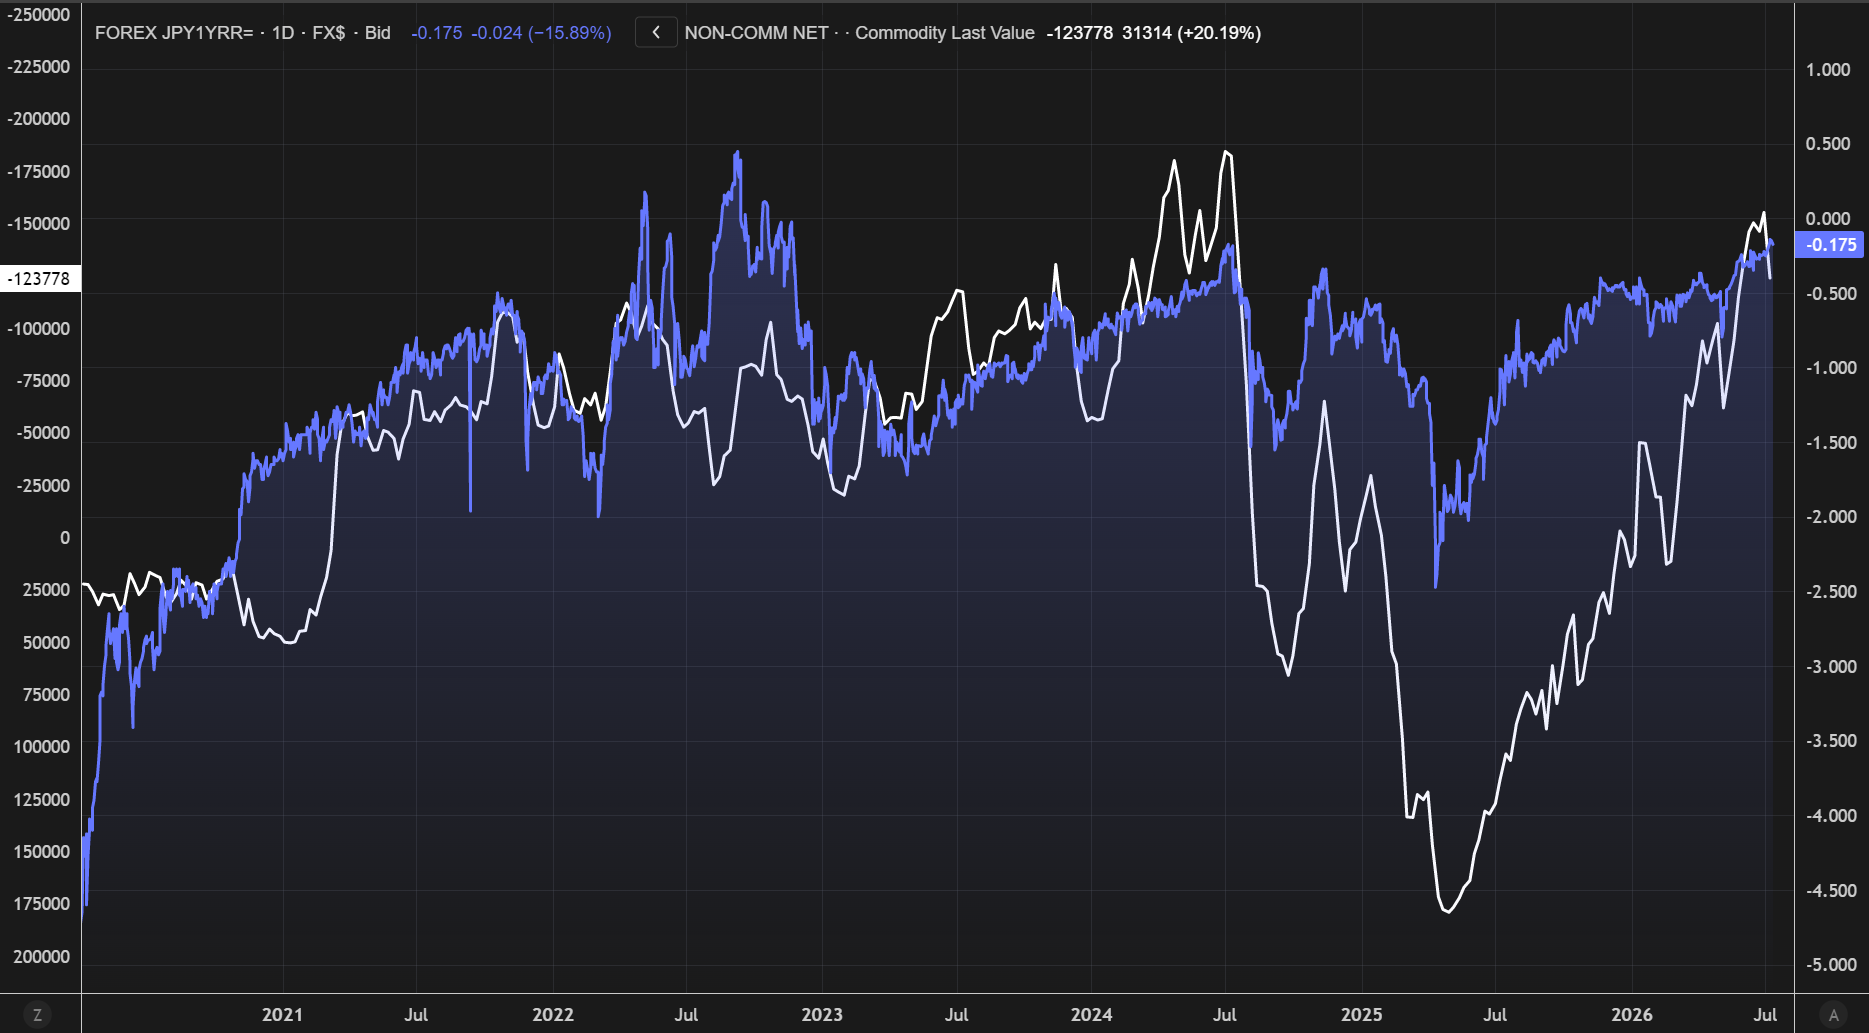
Bearish sentiment toward the yen continues to build, with short JPY positioning nearing the extremes reached in July 2024. At the same time, the one-year USD/JPY risk reversal has turned positive for the first time in nearly four years, underscoring growing demand for upside USD exposure.
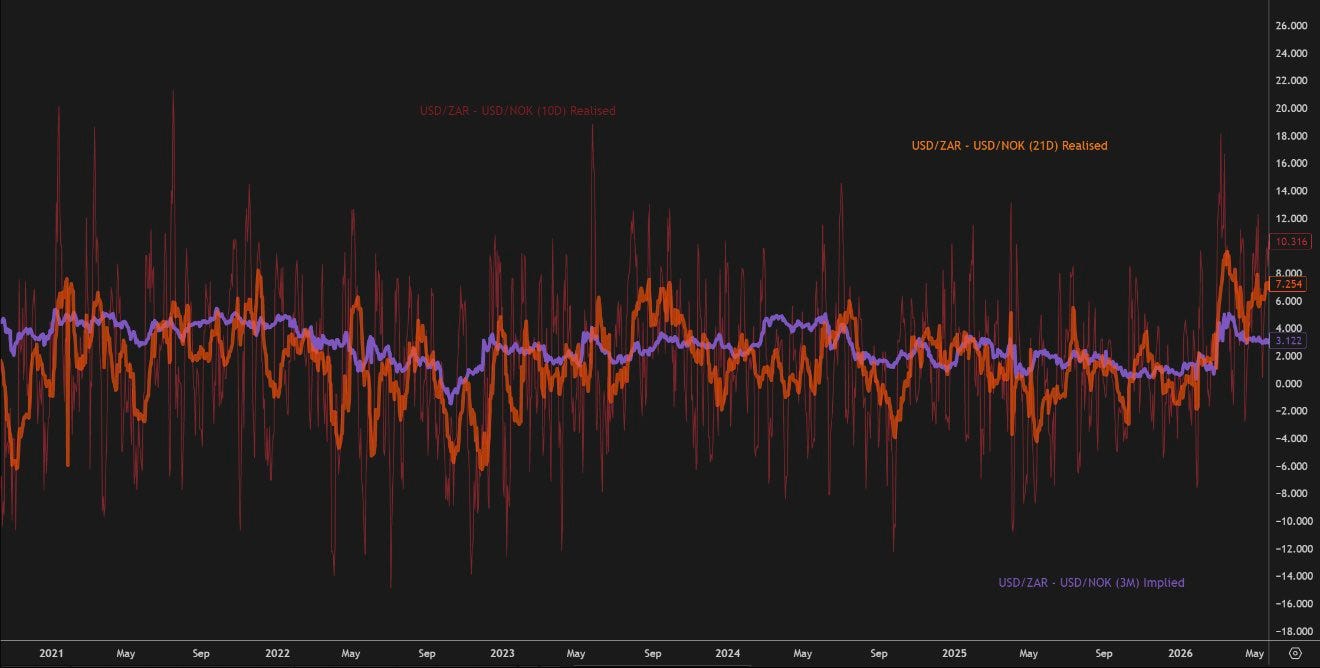
The disconnect in pricing between ZAR and NOK, as reflected in implied versus realized volatility, appears notable. Being long the volatility spread between the two currencies looks attractive. For the second half of 2026, volatility strategies appear to be the most effective way to express views in FX markets.
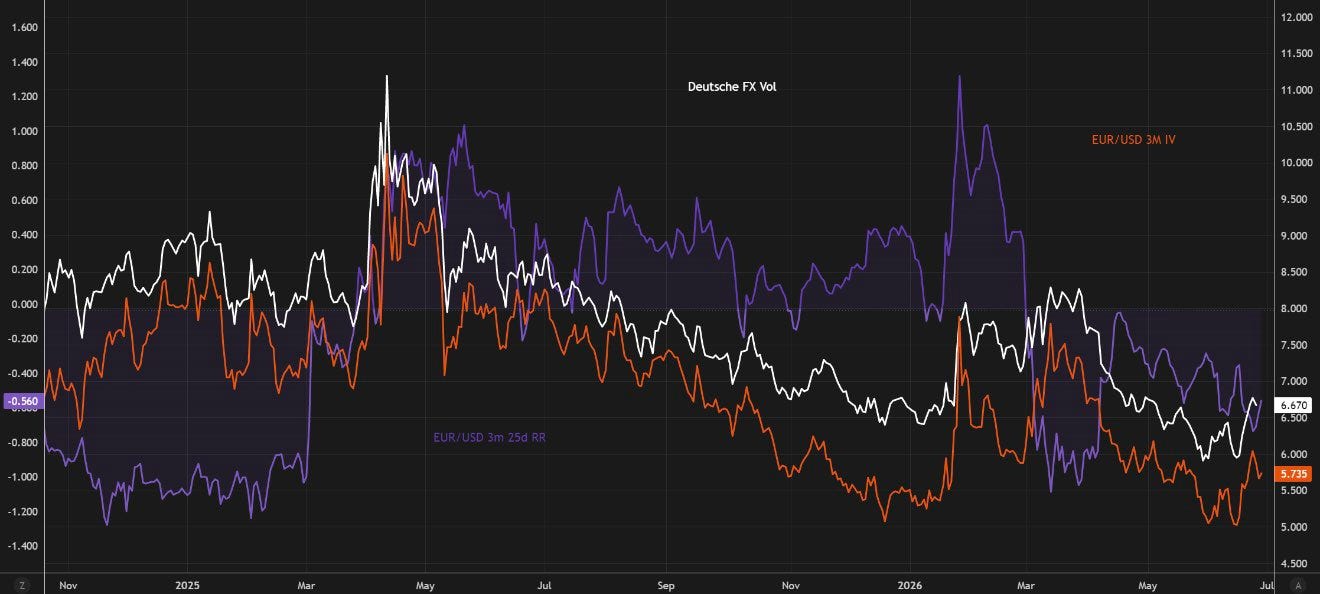
The market may be underestimating USD volatility. Rather than chasing a long USD trade, the better expression is long FX vol: if Fed hawkishness drives EUR/USD below 1.14, the dollar could overshoot, but any weak inflation print or dovish Fed shift could trigger a sharp reversal. Own volatility, not conviction.
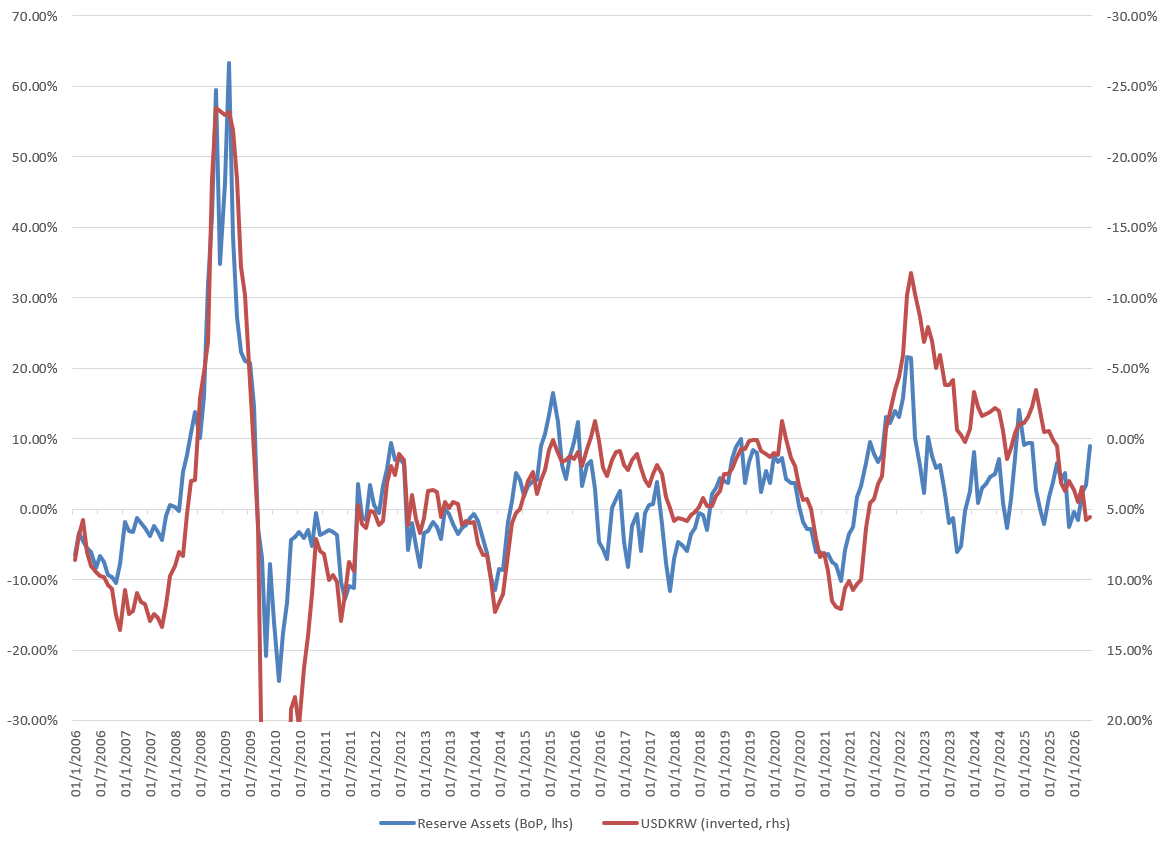
Korea's reserve assets act as a buffer against balance-of-payments pressures and FX volatility, with larger reserve positions historically supporting currency stability. As reserve buffers have diminished and USD outflows increased, the KRW has become increasingly vulnerable to depreciation pressures. This suggests that recent FX weakness reflects capital flow dynamics more than a deterioration in underlying economic fundamentals.
Excellent overview with long end supply
This is some of your best work I’ve read. Well done sir!