

Is Deflation On the Horizon?

Everyone seems to be talking about inflation. I will be discussing why deflation is the real problem that we will see. There are many deflationary signs all around us. I will be discussing the diminishing returns of debt, the velocity of money against total government debt as a % of GDP, credit impulse, demand destruction, building retail inventories, CPI vs. PPI, strong dollar, and finally, the manufacturing index slowing. These are crucial things to understand, as the inflation talk is drowning out the reality of what is taking place at the ground level. So I will do my best to explain why I am still in the deflationary camp and think it is what we should be concerned over.
We will first look at the Marginal Revenue Product of Debt, also known as MRDP. The MRDP is how much GDP is generated for each additional dollar of debt. We can see it takes about 2.5 dollars of debt to produce only one dollar of GDP; this is at all time highs of how much additional debt is needed to produce an additional dollar of GDP. Right now 1 dollar of debt only produces based on the math above 40 cents of GDP growth. This is largely based on the work of Lacy Hunt, who has said that we have long surpassed the phase where additional increases in debt will lead to increased productivity. In economics, we refer to this as the law of diminishing returns. The problem with most of the debt we have taken is that it has been used to subsidize consumption, which is a huge issue. That issue being debt needs to generate income for the repayment of principle again fiscal injections to subsidize consumption does not meet this criterion in the least Chart 1 below shows this concept of MRDP. The shape of the curve is consistent with the law of diminishing returns.

(Chart 1)
For those in the inflation is going higher for longer camp, what would need to happen for that to come to materialize. This can be seen in chart 2 below. This chart shows the relationship between GDP and the velocity of money. This chart shows an inverse relationship between the velocity of money and government debt. When you run a correlation coefficient, you find that r=-.62, so there is a decent inverse correlation between the two variables. As stated, debt holds back increases in the velocity of money. However, the chances or the probability of this happening are low. Absent increases in productive capacity, and thus a stopping of the subsidizing of consumption, the probability that economic growth will surpass the growth of debt is highly improbable.

(Chart 2)
There are two things to look at when we are looking at credit, the first being the year-over-year volume of credit issuance, which is a good measure of banks propensity to lend, and I did touch on this on my last substack. We are not seeing the propensity on the supply side to lend heavily, so one could say there has been little creation in broad money supply from bank lending, which can be seen in chart 3. While it has started to increase, banks still are not lending. If you look at credit impulse, which measures new loans divided by GDP, we see that while it has ticked up on the last quarter-over-quarter metric, it is only slightly above trend. This can lead one to deduce that new loan creation is still struggling. This can be seen in chart 4 and is pulled from micro macro. This goes back to the point I made above that based on this, the demand again for credit is contracting, and thus broad money supply will continue to be destroyed as those loans are repaid, and absent more loan growth broad money supply will struggle to grow.

(Chart 3)

(Chart 4)
There is much talk around demand destruction, but demand destruction is already here. If you look from April 2021 to April 2022 there was roughly 1.6 trillion in consumer spending. We have seen that this came from a 1.5 trillion-dollar drawdown in consumer savings and roughly 120 billion in credit card debt. The consumer drawdowns and credit card upticks can be seen in chart 5. We are seeing consumers continue to use more and more extreme measures to continue levels of consumption they are used too. The issue is that the fiscal tailwind we received during the beginning of COVID is in the rear-view mirror. There is nothing else consumers can hope for in the near term to offset higher prices. The ability of retailers to pass on higher prices was easier with that fiscal tailwind. As that helped the consumer feel “less pain” from higher prices as they were basically being subsidized. However, absent this fiscal tailwind, now the ability of businesses to pass on higher prices is going to deteriorate.

(Chart 5)
Deterioration has already begun and can be seen with the wholesale inventories numbers below in chart 6 and retail inventories in chart 7. What we are seeing is retailers prepared for consumers to continue consumption patterns. However, as consumers have had to make trade-offs, inventories have started to build. These wholesale and retail numbers and building of inventories is going to be deflationary, as these retailers and wholesalers run into the problem of the inability to pass on the higher prices. Thus, you will see margin compression as they are forced to eat the costs and realize that they cannot pass higher prices on to the consumer.
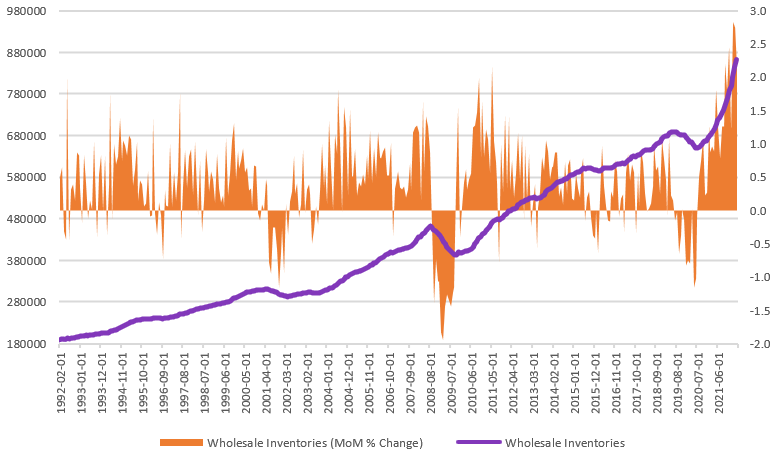
(Chart 6)

(Chart 7)
Stephanie Pomboy made another excellent reference, and this can be seen in chart 8 below. She discusses that one needs to look at the difference between the CPI and PPI. PPI is the prices businesses pay, and CPI is what the consumer is paying, and looking at the difference in the two measures, one can see the negative gap which is favoring consumers over businesses. Yes, I said, favoring consumers over businesses. Most of those businesses, as discussed above, are the ones eating most of the cost, as that fiscal tailwind is gone, and companies are usually reluctant to raise prices unless necessary. We might have what is known as shrinkflation, where businesses keep the price the same but offer the goods with less quantity. However, on net businesses have not wanted to raise prices. So, the ability of a business to pass on costs you saw early in the pandemic is reversed quickly in the rate of change terms. It has since slowed, but again consumer is fairing better than businesses. This will lead to the possibility of a recession, which means slowing growth. Slowing growth kills inflation.

(Chart 8)
The dollar strength has surprised many, and everyone called for a dollar collapse at the beginning of the crisis. However, quite the opposite has taken place, and the dollar has seen solid strength. We have two problems which can be seen in chart 9, and this is the G7 countries simple average of cross-currency basis swaps on the 5-year tenor against the DXY (dollar index). What once can see is the strong inverse relationship between the two. When the DXY is strong, the basis becomes more negative, and when DXY is weak, the basis moves upwards towards the 0 bound. However, it has not been able to crack that 0 bound. This means that there has been a dollar shortage for years now, and this is deflationary. The strength of the dollar also has benefits for lowering commodity prices.
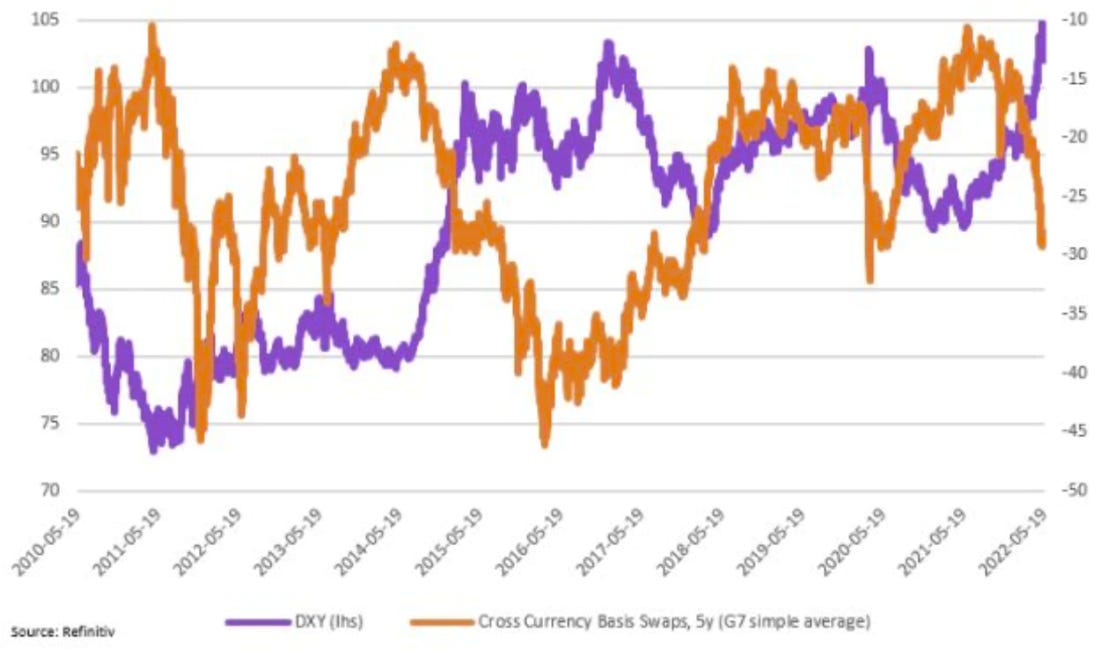
(Chart 9)
When we think of the dollar and its relation to commodity prices, we must think about how it affects many Emerging Market (EM) economies that are commodity rich. Stronger dollar helps lower commodity prices, and as shown in chart 10 below. There is an inverse relationship between the dollar and commodity prices. When the dollar weakens, commodity prices go higher and vice versa. Below as the dollar has started to strengthen and looking at a rate of change basis (YoY % change) one can see that dollar strength is starting to pull down the Refinitiv Commodity Index. As we proceed, and as the dollar continues to strengthen due to a shortage of dollar liquidity, we will see continual increase of dollar which should cause more downward pressure on commodity prices.

(Chart 10)
Finally, there is the manufacturing component. The Philly Feds 6-month forecast has slowed dramatically, which points to a slowing of manufacturing. This will slow growth, which is a structural headwind for higher inflation. Growth has deteriorated, and this contraction within the Philly Fed index will lead to further deterioration within the ISM. The sentiment around manufacturing will be echoed throughout the rest of the USA. The relationship between the Philly Fed and ISM can be seen below in chart 11.

(Chart 11)
In conclusion, looking at all the different components around the US, it would be hard to say that there is not deterioration within the economy from a growth perspective. We have first the declining marginal revenue product of debt, constraint debt has on velocity, bank lending is weak, consumers inability to handle higher prices, retail inventories and wholesale inventories building, businesses' inability to pass on higher prices, CPI vs PPI, and the implications that the difference between those two measures has, a strong dollar and its deflationary effects for not just the US but globally as people hoard dollars, strong dollar and its ability to lower commodity prices, and finally deteriorating within the manufacturing base. Looking at all these factors it is tough to say that there will not be any structural headwinds for inflation, and most of the indicators are pointing towards deflation being the real issue that we will see here soon. I cannot repeat this enough, again slowing growth will kill inflation.