Global Rates The Battle Continues
After the recent geopolitical instability in the Middle East, interest rates have become a significant point of concern. There has been considerable discussion regarding the fluctuations in rates and what the future holds. Additionally, we have witnessed central bankers stating that if the term premium continues to rise, interest rates may continue to climb, potentially allowing central bankers to reduce their intervention. This situation prompts us to consider the future direction of interest rates.
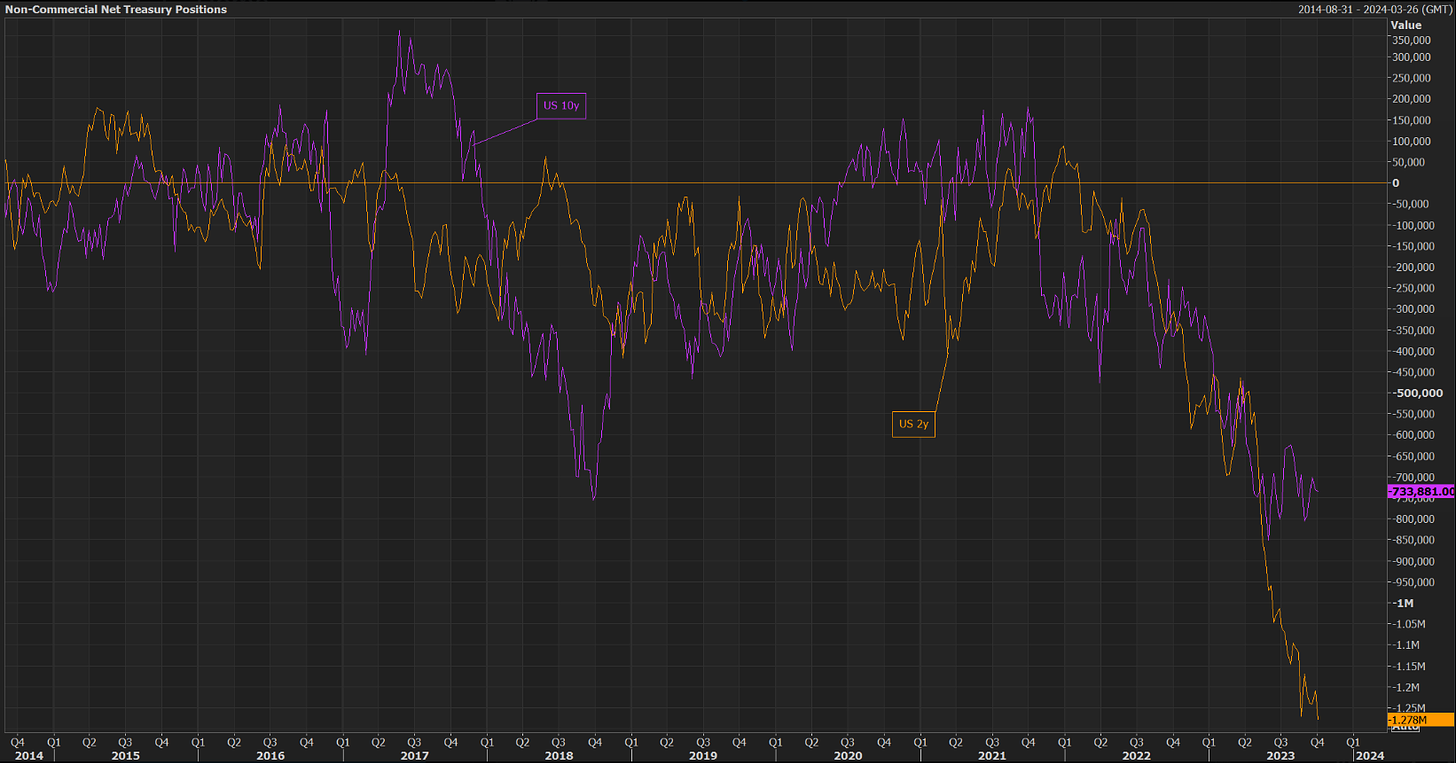
One of the initial factors to consider is the current positioning in the market. There has been a significant accumulation of short positions. The continuous addition of short positions in US Treasury futures has now reached historically high levels. It's crucial to bear in mind that this could impact the potential for yields to have reached their peak.
The investors who are entering the Treasury market at this point are likely to be more sensitive to changes in prices and more reliant on leverage than they have been in recent years. This poses concerns for funding costs, as they may increase, and it might also contribute to maintaining relatively stable term premia. Furthermore, this situation could lead to more affordable swaps, potentially acting as a pressure relief mechanism. (Figure 1)
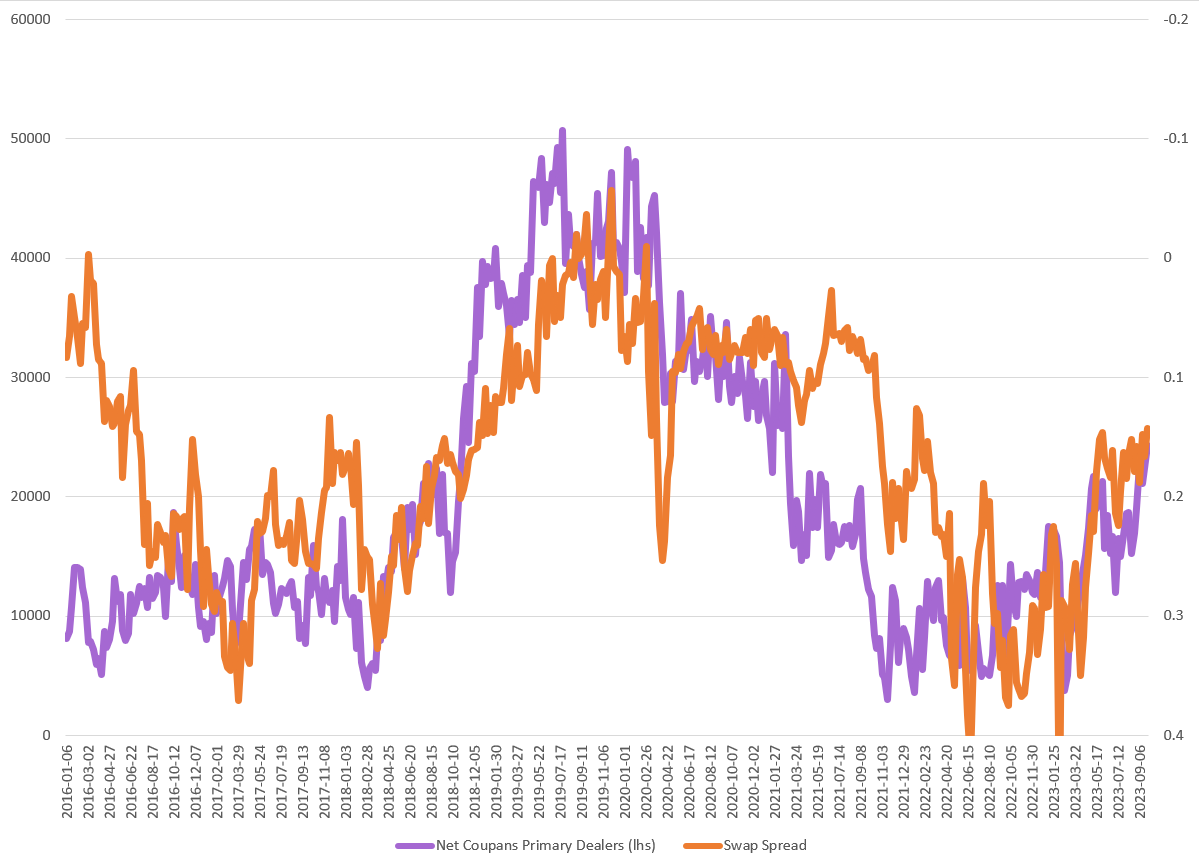
The next question revolves around the supply and demand dynamics within the Treasury market. There is an anticipation that net coupon issuance will reach approximately $400 billion by the end of Q4 2023, which represents a substantial increase in supply. The crucial question is whether the market will be able to absorb this influx of supply.
When we analyze the current dynamics, we find a significantly different scenario compared to the conditions during the COVID-19 pandemic. Back then, there was a massive demand from foreign institutions, central banks, and commercial banks. However, the profile of the marginal buyer of treasuries has changed today. Leverage is expected to play a much more significant role, and I anticipate that the term premium will remain relatively stable. This stability should help prevent further upward pressure on term premium, which often drives interest rate movements. Additionally, this increase in new coupon issuance is likely to have the effect of reducing swap spreads going forward. (Figure 2)
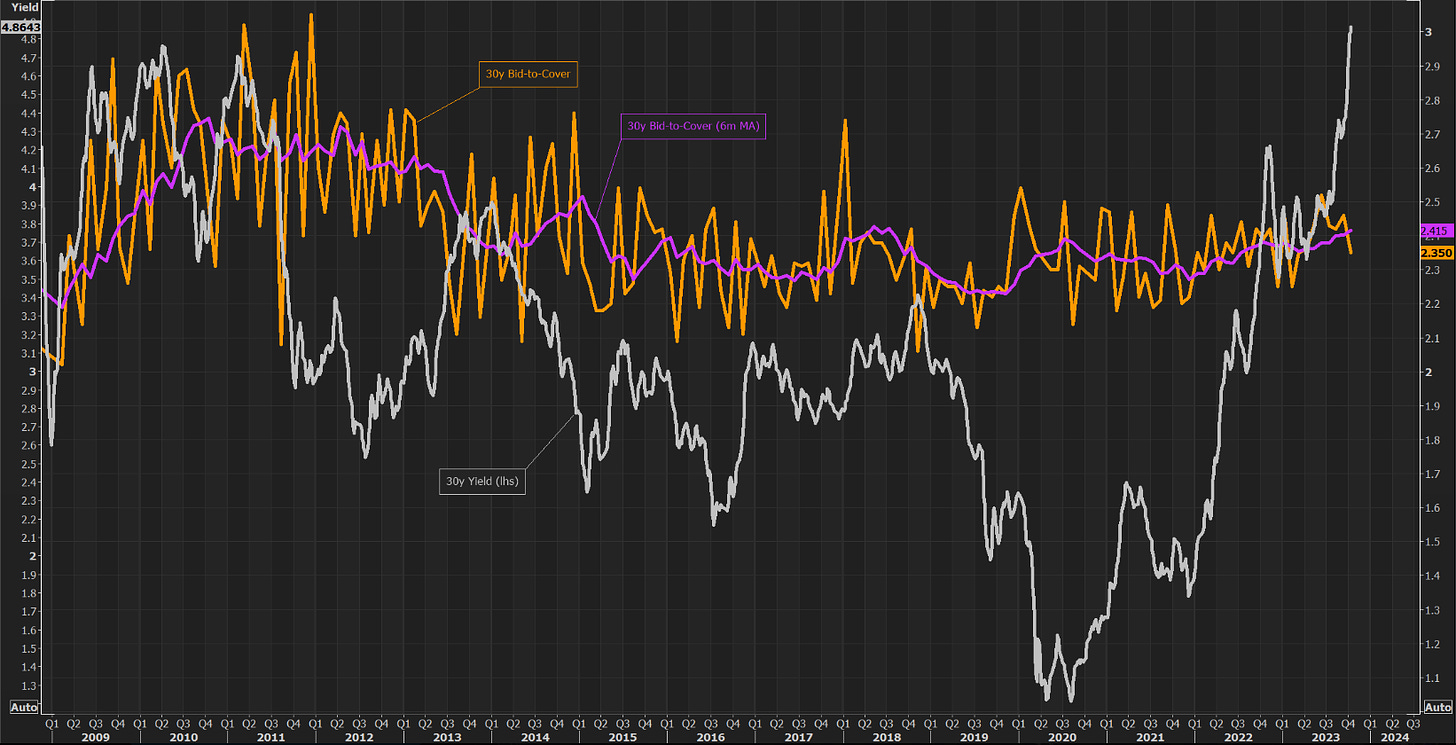
Staying with the dynamics of supply/demand we will look at both 30y and 10y supply/demand dynamics. Looking at today's auction, the bid-to-cover ratio, which is the nominal dollar amount of bids received divided by the nominal dollar amount of bids accepted, reveals a decline in demand for the 30-year bond. It's clear that demand for the longer end of the yield curve remains relatively weak. Additionally, the nominal dollar amount of accepted bids, which measures the supply, has remained flat for the month at $20.0 billion (Figure 3). In contrast to the 30-year bond, the 10-year bond has experienced a significant level of demand. When examining the six-month moving average, we observe an increasing bid-to-cover ratio, indicating that demand typically exceeds supply for the 10-year bond (Figure 4).
US rates are on an upward trajectory, and the intermediate part of the curve is significantly underperforming. Economic data continues to exceed expectations, particularly with robust retail sales. In the event that the Federal Reserve maintains a dovish stance, we can anticipate a steeper yield curve and a widening of inflation breakeven spreads. However, it's worth noting that the market may continue to price in rate hikes, which could push the intermediate and long end of the yield curve higher. This implies a potential scenario of a steeper yield curve and higher interest rates. It's advisable to monitor 5s30s curve steepeners as an indicator going forward (Figure 5).
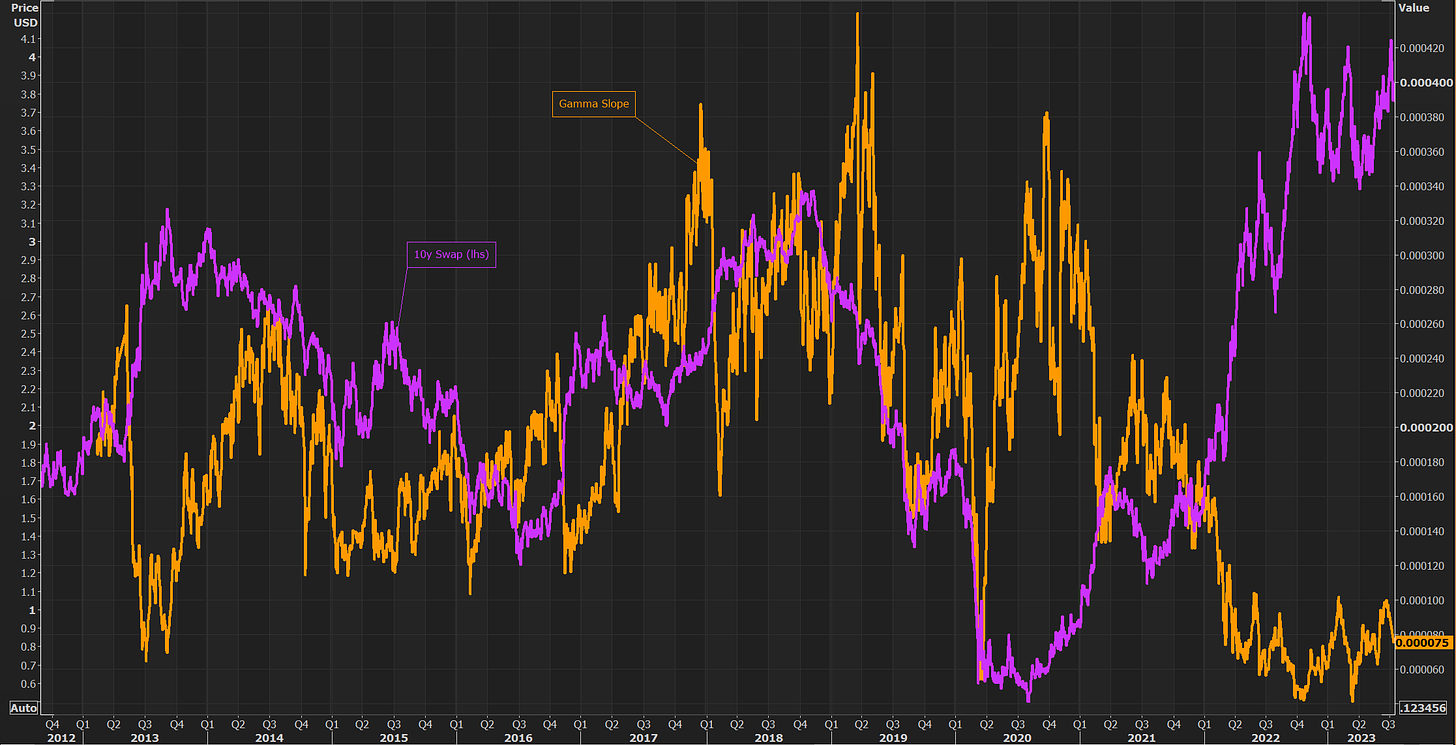
With the recent strong performance of the 10-year yield over the past few days, there is growing interest in when it will stabilize and begin to decline. One way to assess this is by looking at swaptions with shorter expiration dates, as they exhibit more gamma exposure compared to swaptions with longer maturities. A useful metric for comparison is short/long implied volatilities, which helps gauge the demand for the most gamma-intensive expirations.
When the yield curve slopes upward, it often reflects a more accommodative interest rate environment, while a downward-sloping curve may indicate concerns about volatility in the rates market. As illustrated in Figure 6, changes in the gamma slope are closely correlated with changes in interest rates.
Given the ongoing uncertainty surrounding interest rates and forward guidance, there should be sustained high demand for gamma-intensive expirations. This increased demand is likely to contribute to a downward-sloping gamma curve
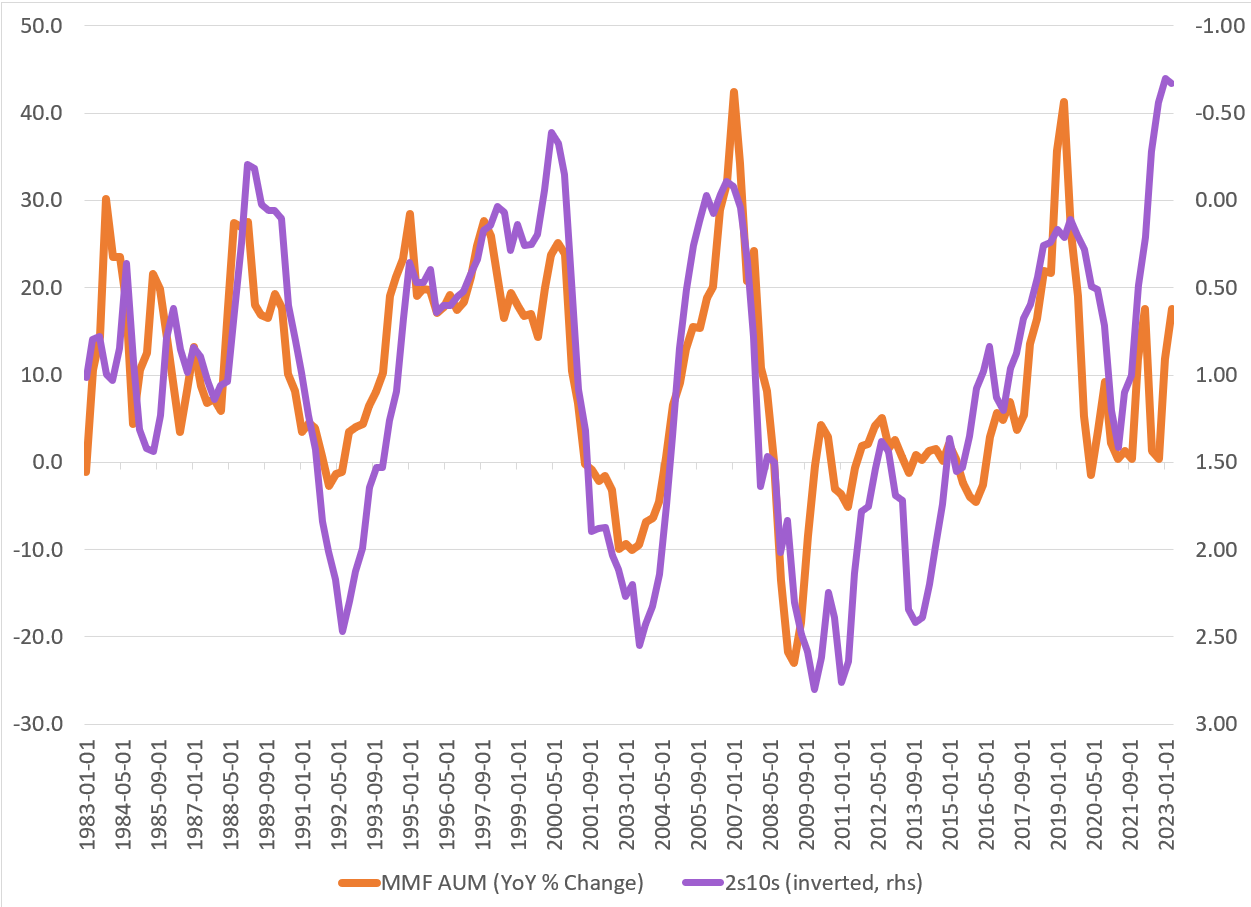
Another noteworthy trend is the shift in money market flows, as we continue to observe a move away from the overnight reverse repo facility and a preference for holding bills, which have increased by almost $150 billion as of the end of last month (September). Additionally, there has been a significant uptick in money market funds' holdings of US treasuries, rebounding from recent lows.
Examining Figure 7, if the 2s10s yield curve becomes more inverted, it's possible that we will see more inflows into money market funds. However, given the recent movement in the 2s10s curve, there is a chance that these inflows into money market funds could reverse.
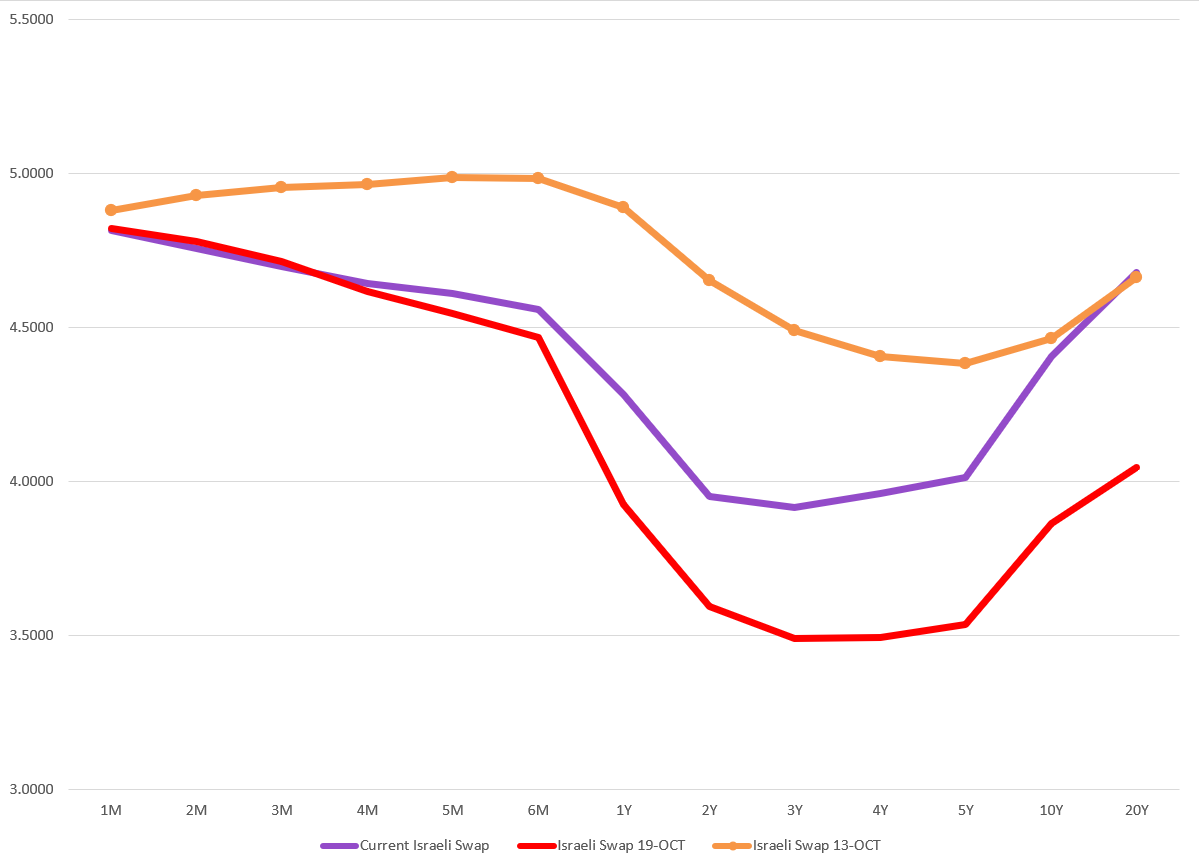
Considering the recent developments in the Middle East and the increasing geopolitical instability, it appears that the market is bracing for potential monetary stimulus measures in Israel. As the situation initially unfolded, we witnessed a swift shift in the curve, with expectations of policy rate cuts being factored in. However, I'm uncertain whether these measures will materialize as quickly as the market expects, particularly given the current state of the foreign exchange (FX) market.
In my opinion, it might be prudent for Israel to prioritize stabilizing its currency before implementing any significant monetary stimulus measures (refer to Figure 8). This cautious approach could be a more strategic move in the current circumstances. Fading this moves in rates on the front-end seems best until more clarity around shifting from FX focus to stimulus or consumption based model is hinted at. As for now, the focus seems to be on stabilization of the currency.
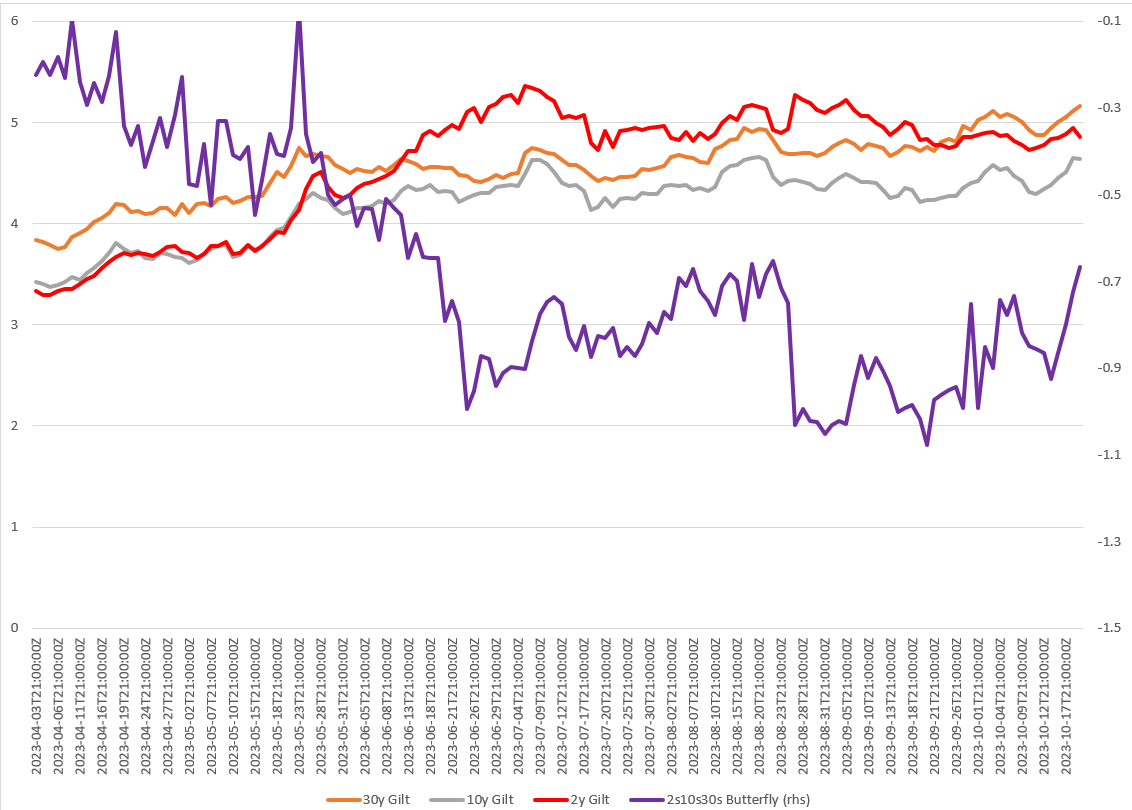
When assessing the gilt market, it's currently more attractive to consider the front and back-end of the curve compared to the belly. Market expectations are for the front-end of the yield curve to remain relatively stable. In this context, the 2s10s30s gilt curve appears appealing, and it's worth explaining what this strategy entails.
The 2s10s30s strategy involves positioning trades based on the shape of the yield curve. If you anticipate that the belly of the curve will experience more significant movements compared to the wings (the shorter and longer maturities), you may opt for a more humped curve. I will provide an explanation of this concept shortly.
If you believe the yield curve will become more humped, you would sell the belly (10-year maturities) and buy the wings (2-year and 30-year maturities). Conversely, if you expect the curve to become less humped, you would do the opposite. It's essential to emphasize that this trade is about capitalizing on changes in the curvature of the yield curve rather than changes in the overall level of yields. This distinction is crucial to bear in mind.
In the context of Figure 9, the suggested approach would be to sell the 10-year maturities (the belly) and take long positions in the 2-year and 30-year maturities.
A lot of interesting things going on in the rates market over the past couple of weeks, and it is something that many people are discussing. There are many places in which one can look and see opportunities that are interesting across the globe. This is something that I will continue to focus on throughout the end of the year.


