EM and DM World Macro

Introduction
Opportunity across both developed and emerging markets is increasingly being shaped by a synchronized shift in global macro conditions.
Within this backdrop, emerging markets have been a primary beneficiary. A softer U.S. dollar, alongside declining real yields, has reduced external financing pressures and improved FX stability across several EM economies. This has supported renewed capital inflows, particularly into local currency debt and select equity markets where real rate differentials remain attractive.
At the same time, dispersion across regions remains elevated. In developed markets, curve dynamics whether driven by policy repricing or term premium expansion continue to influence valuation frameworks, particularly in duration-sensitive sectors. In emerging markets, the interplay between FX stability, inflation trajectories, and central bank credibility is driving differentiation in performance.
Taken together, the current environment presents a multi-asset opportunity set where relative value across rates, FX, and risk assets remains elevated. The combination of easing financial conditions, improving liquidity dynamics, and selective macro resilience continues to underpin the case for both developed and emerging market exposure.
Macro
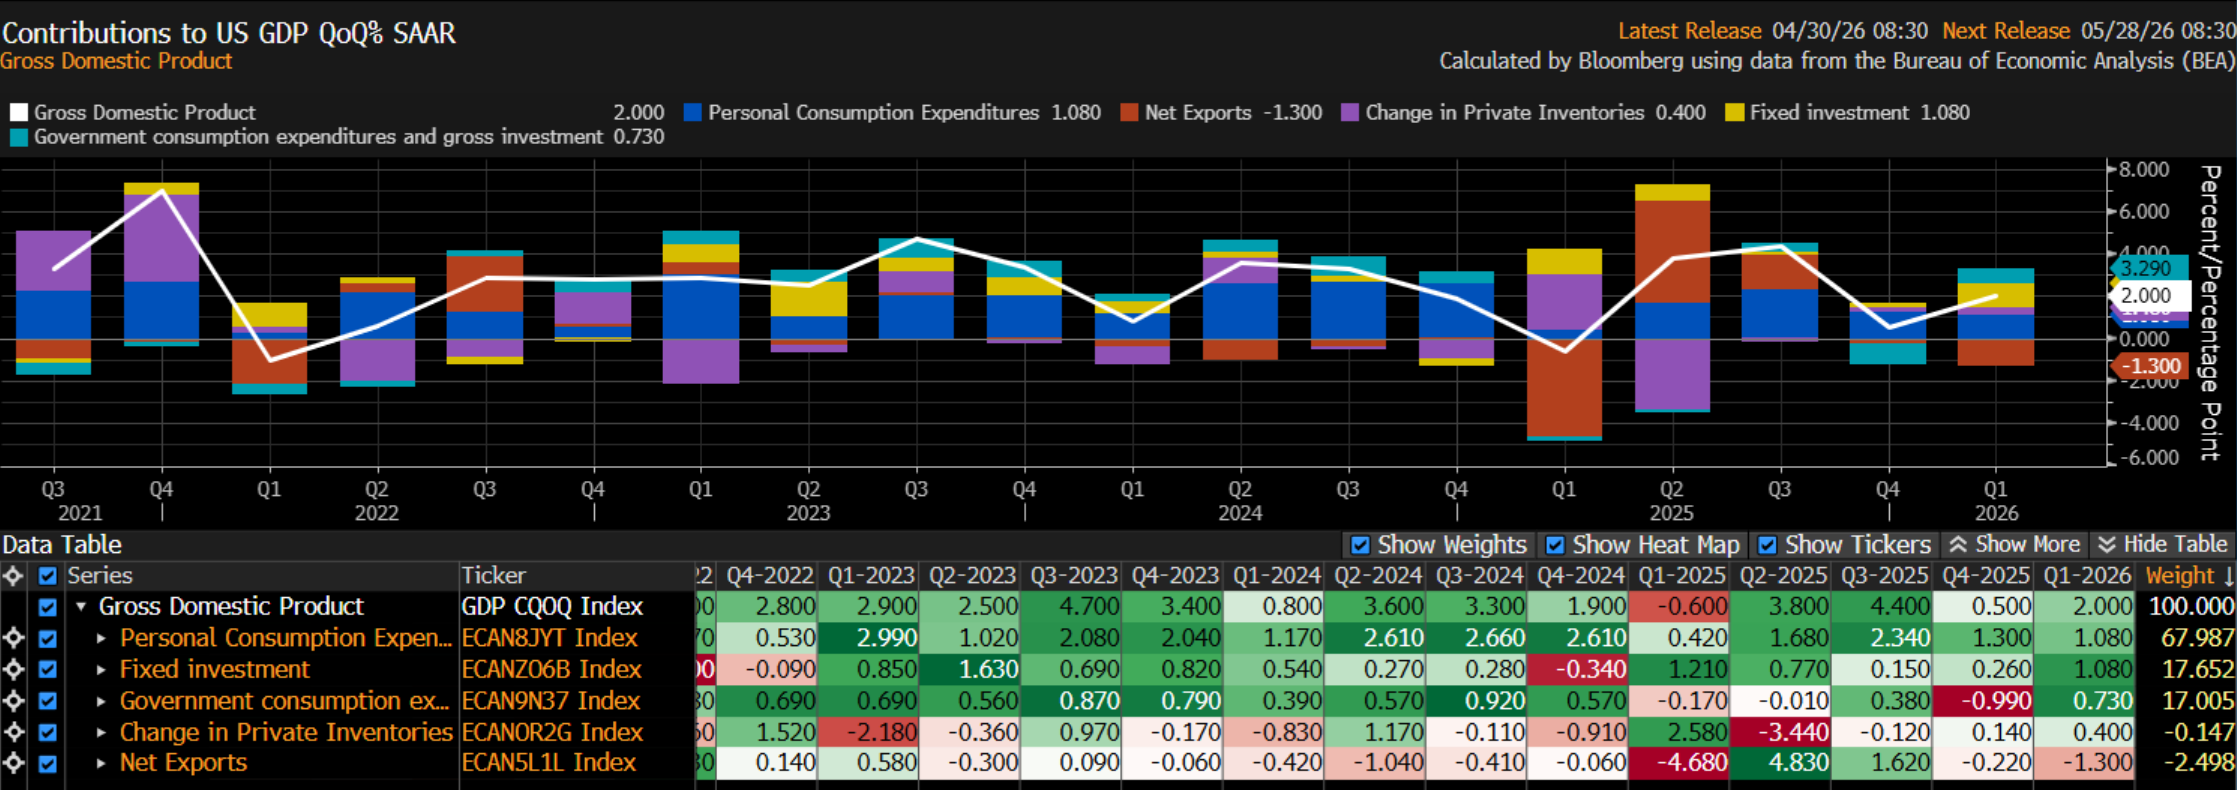
For Q1 2026, consumption slowed. Goods spending was weak, with durable goods relatively unchanged and nondurable goods spending declining. Services held up, but much of the strength came from final consumption expenditures of nonprofit institutions.
Net exports were an unexpected drag, subtracting 1.3% from GDP. While export growth was solid, contributing 1.32% to GDP, imports rose sharply and detracted 2.62%. The surge in imports was most likely driven by a flood of goods entering the United States following the rollback of tariffs.
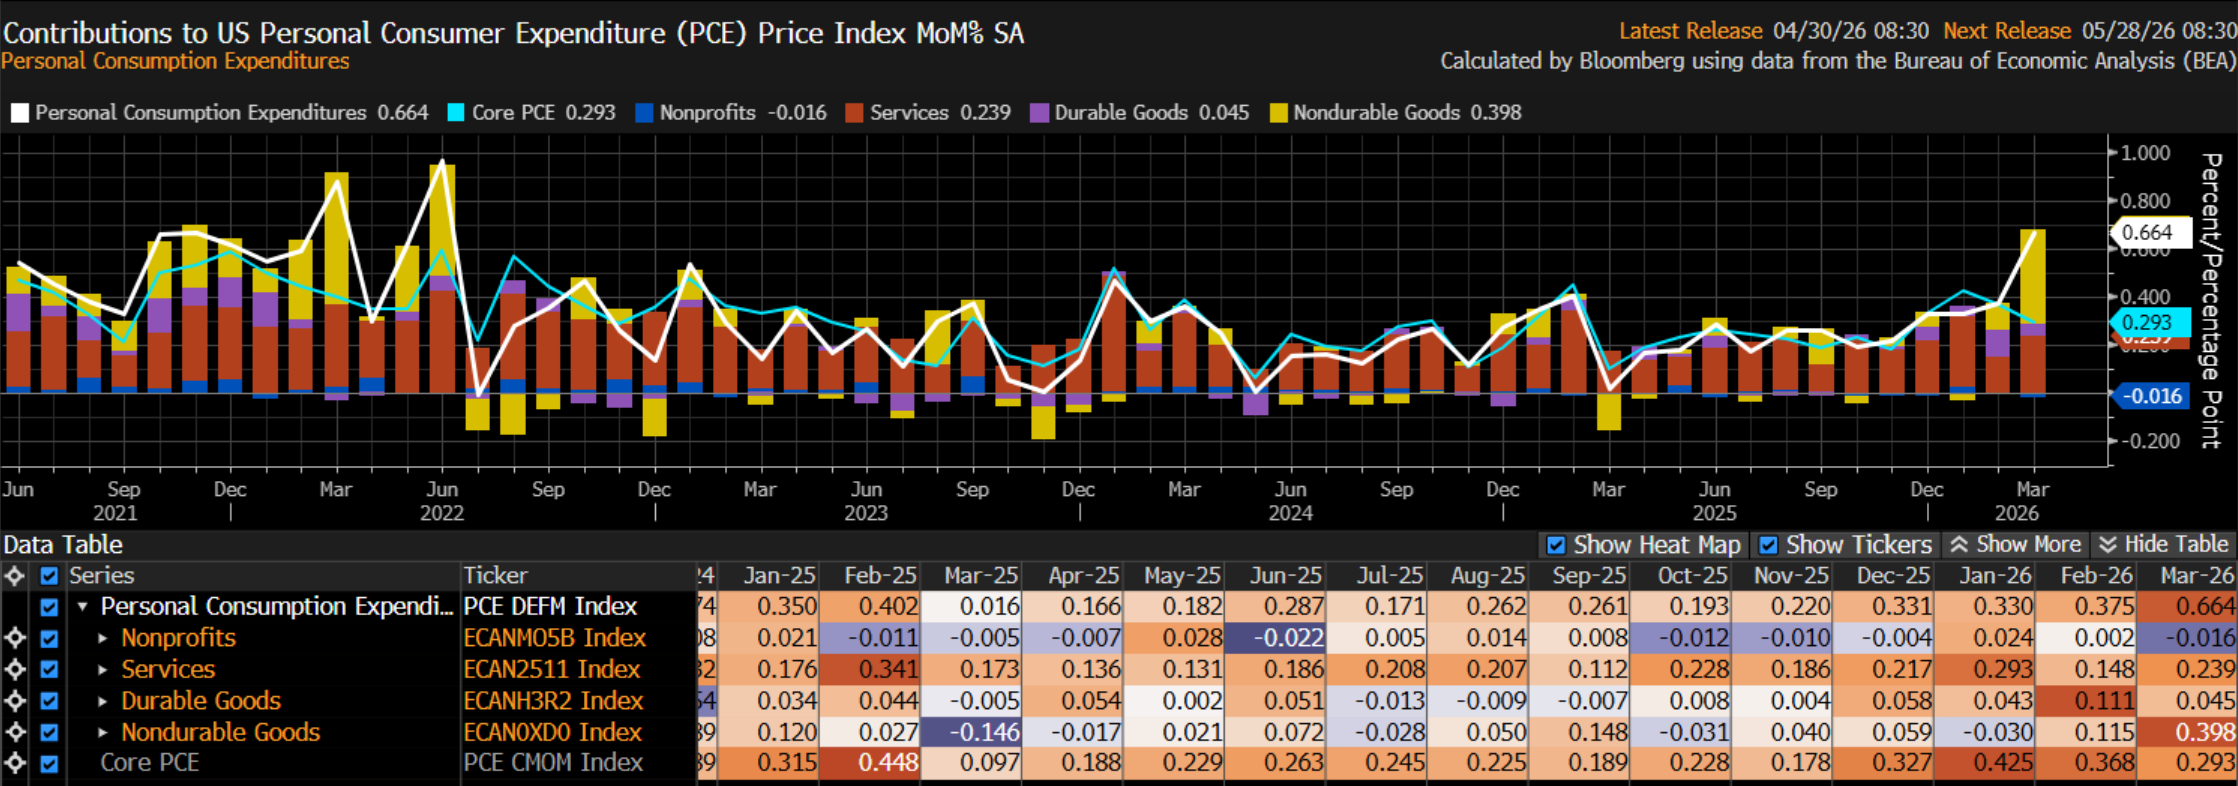
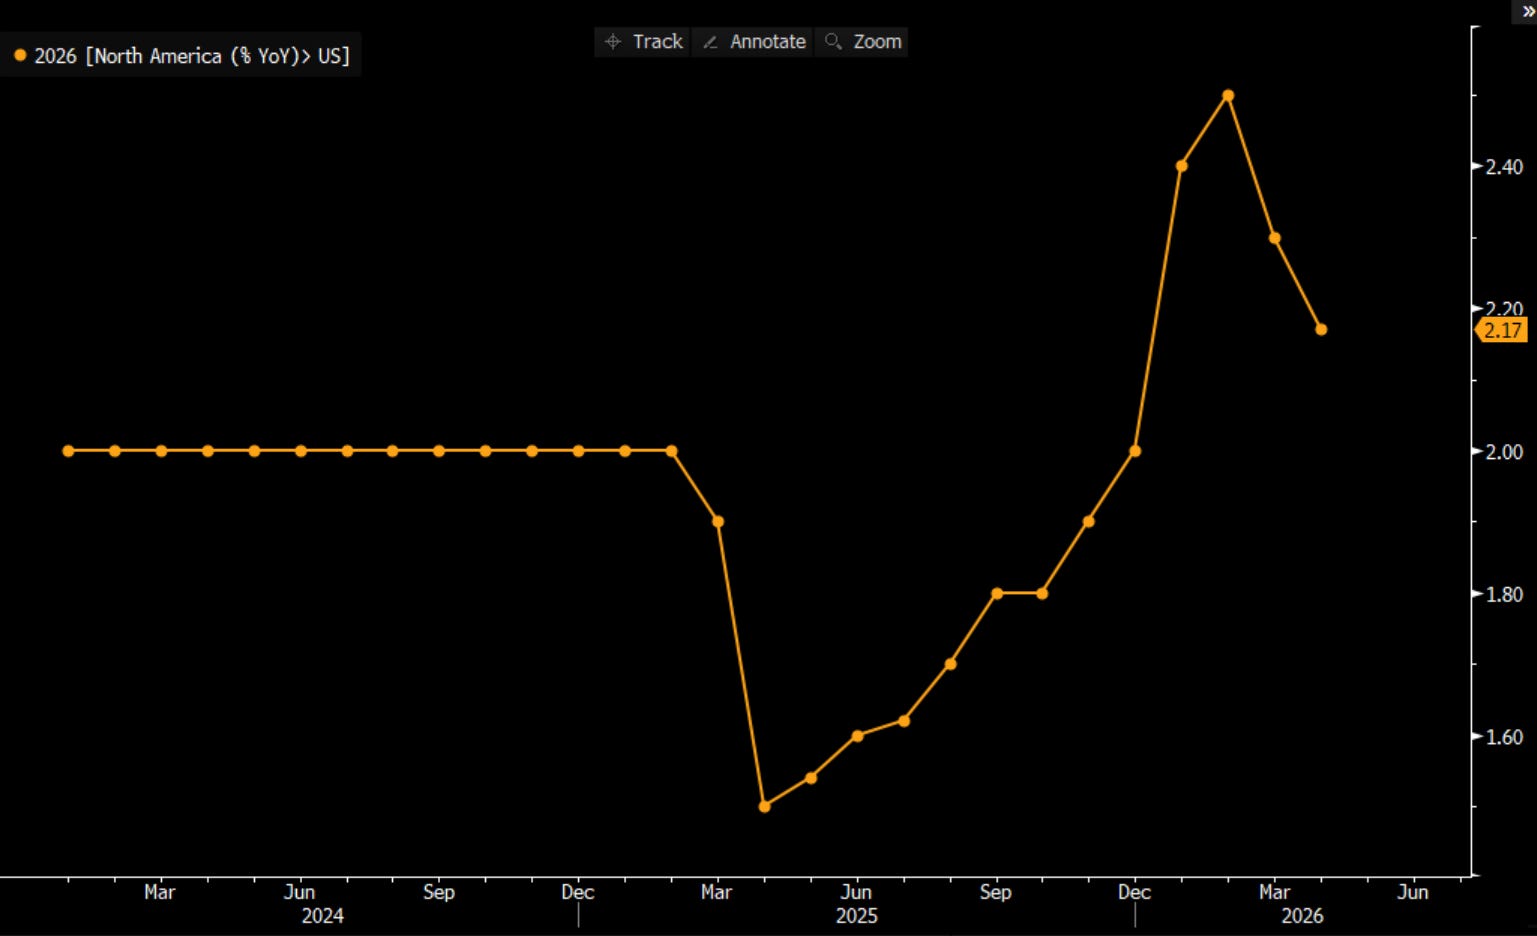
Inflation likely reaccelerated in March, driven primarily by a sharp rise in energy prices, pushing headline PCE higher on both a monthly and annual basis. Core inflation remains elevated, with quarterly momentum picking up, although shorter-term measures suggest some moderation.
On the income and spending side, household demand showed resilience. Personal income rebounded modestly, while consumer spending strengthened, supported in part by tax refunds. However, spending growth outpaced income, leading to a decline in the savings rate.
Overall, the primary inflationary impact from geopolitical tensions has come through higher energy costs. While consumers have so far absorbed the shock helped by income support and accumulated wealth this cushion may fade if elevated energy prices persist.
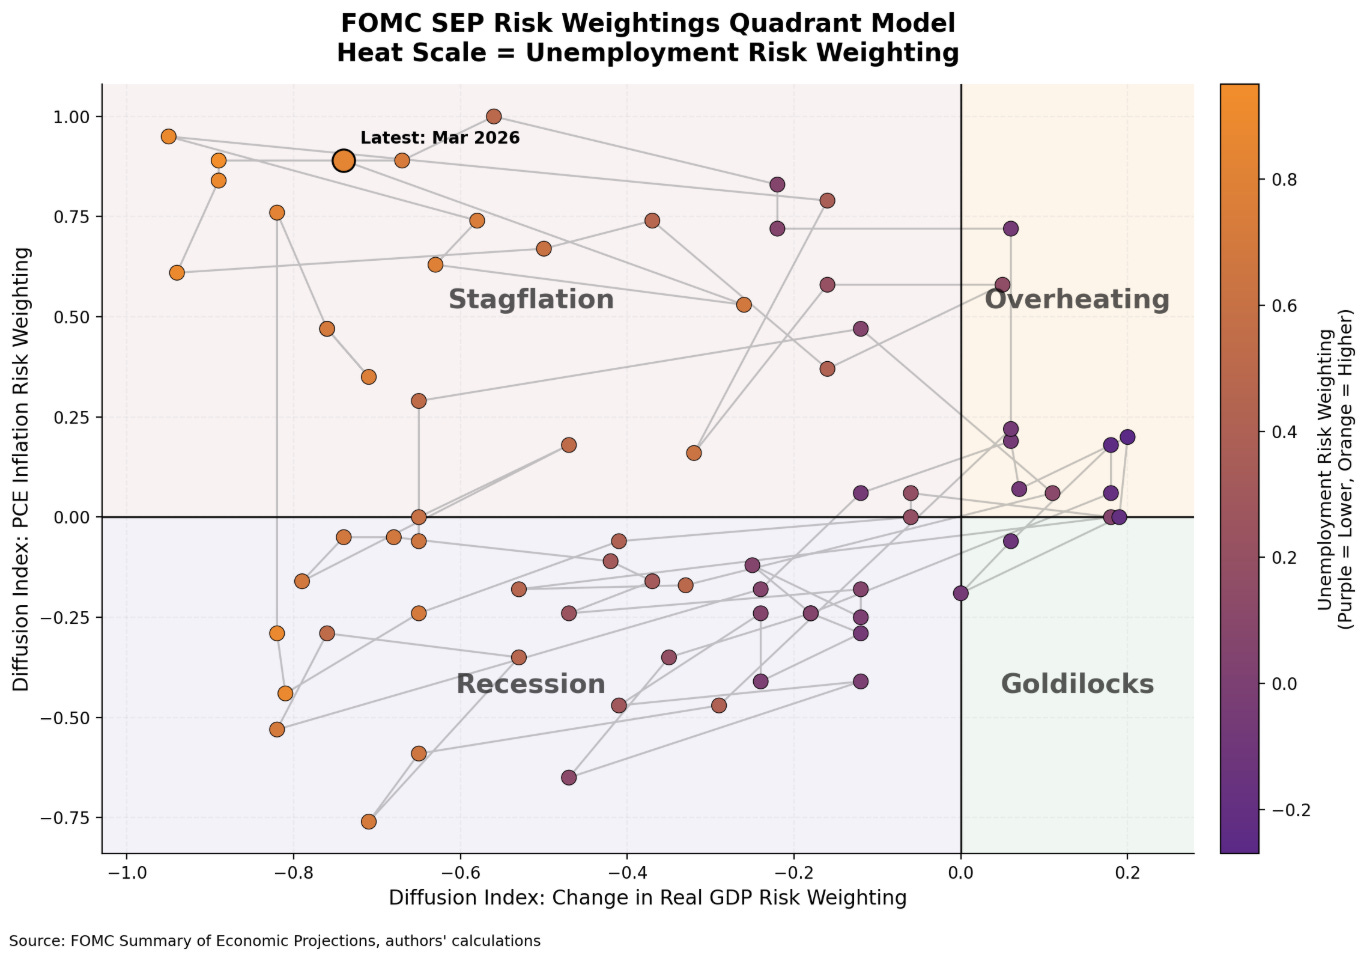
SEP Diffusion does not equal forecasts. It’s risk skew, not outcomes. The chart states the Fed has consistently seen stagflationary asymmetry when with markets priced for Goldilocks.
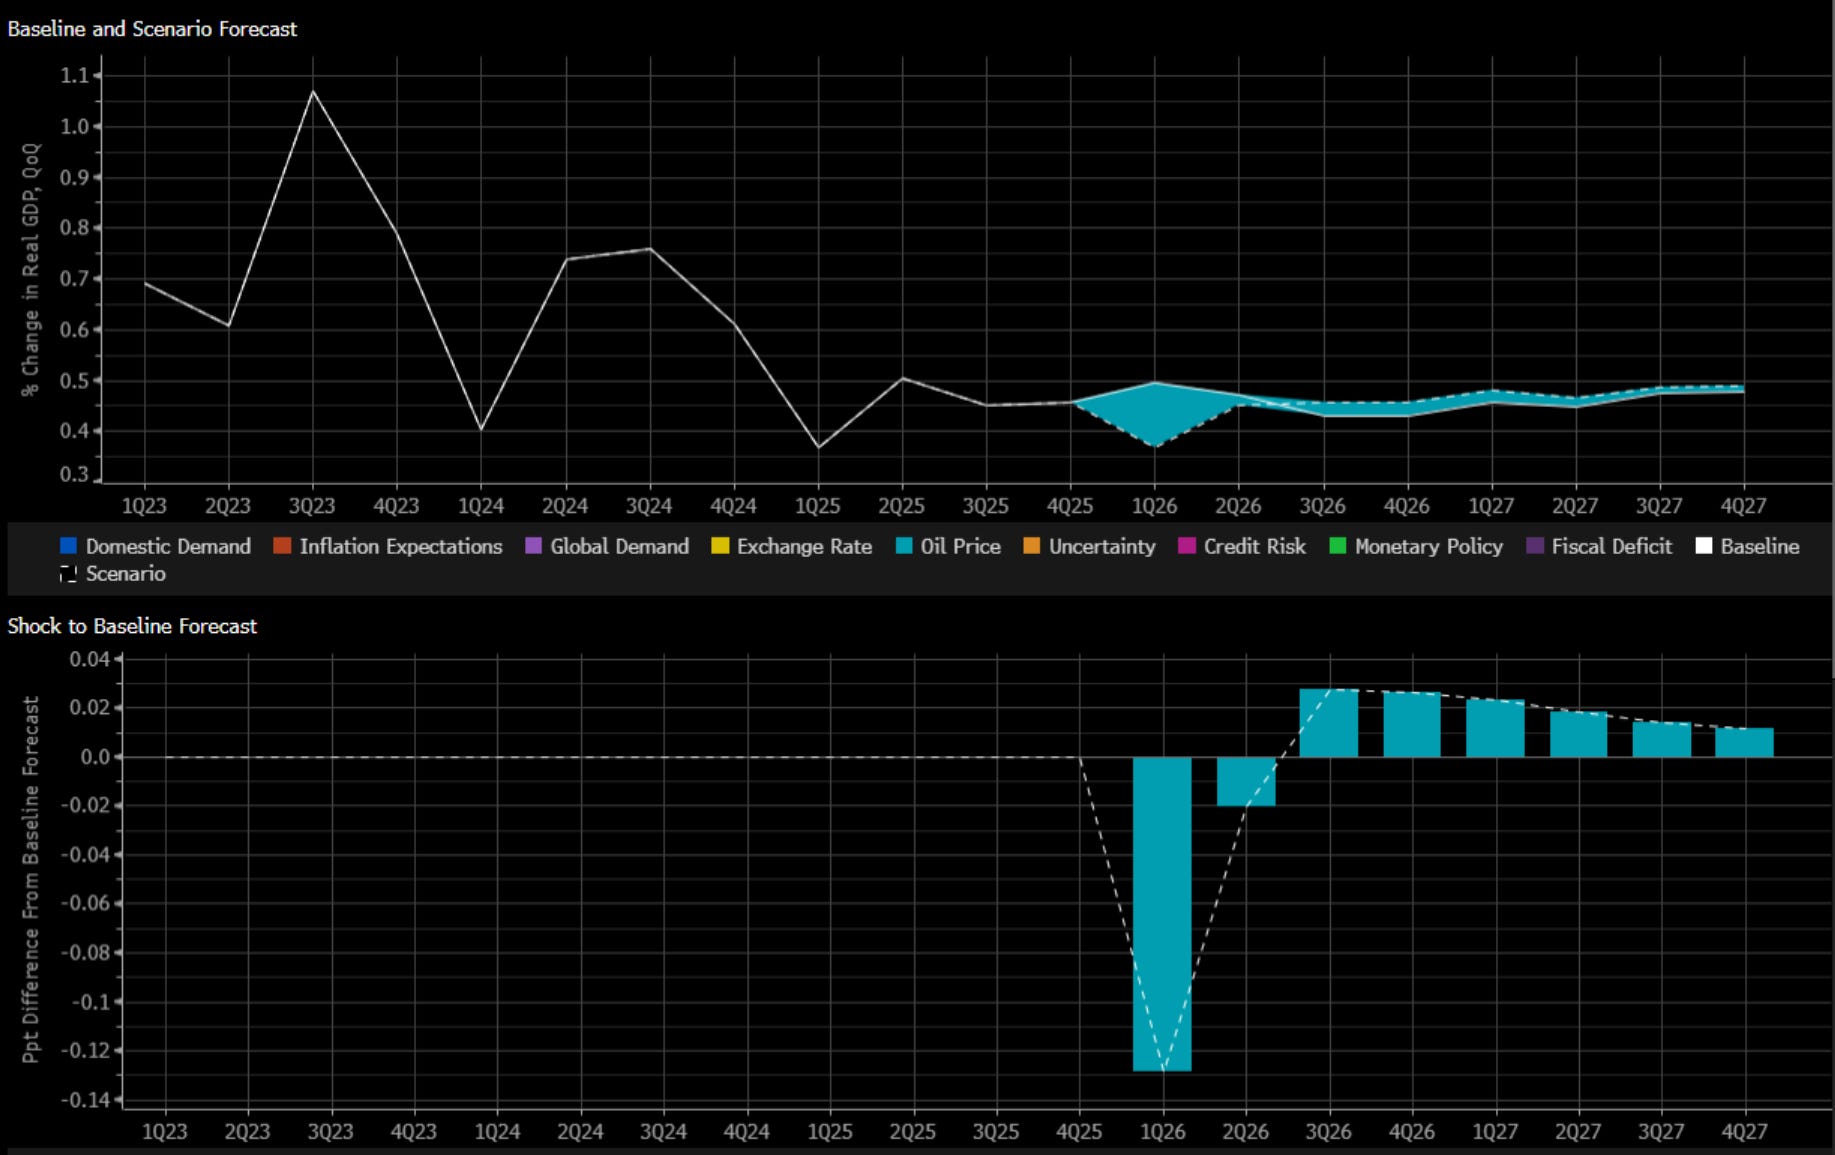
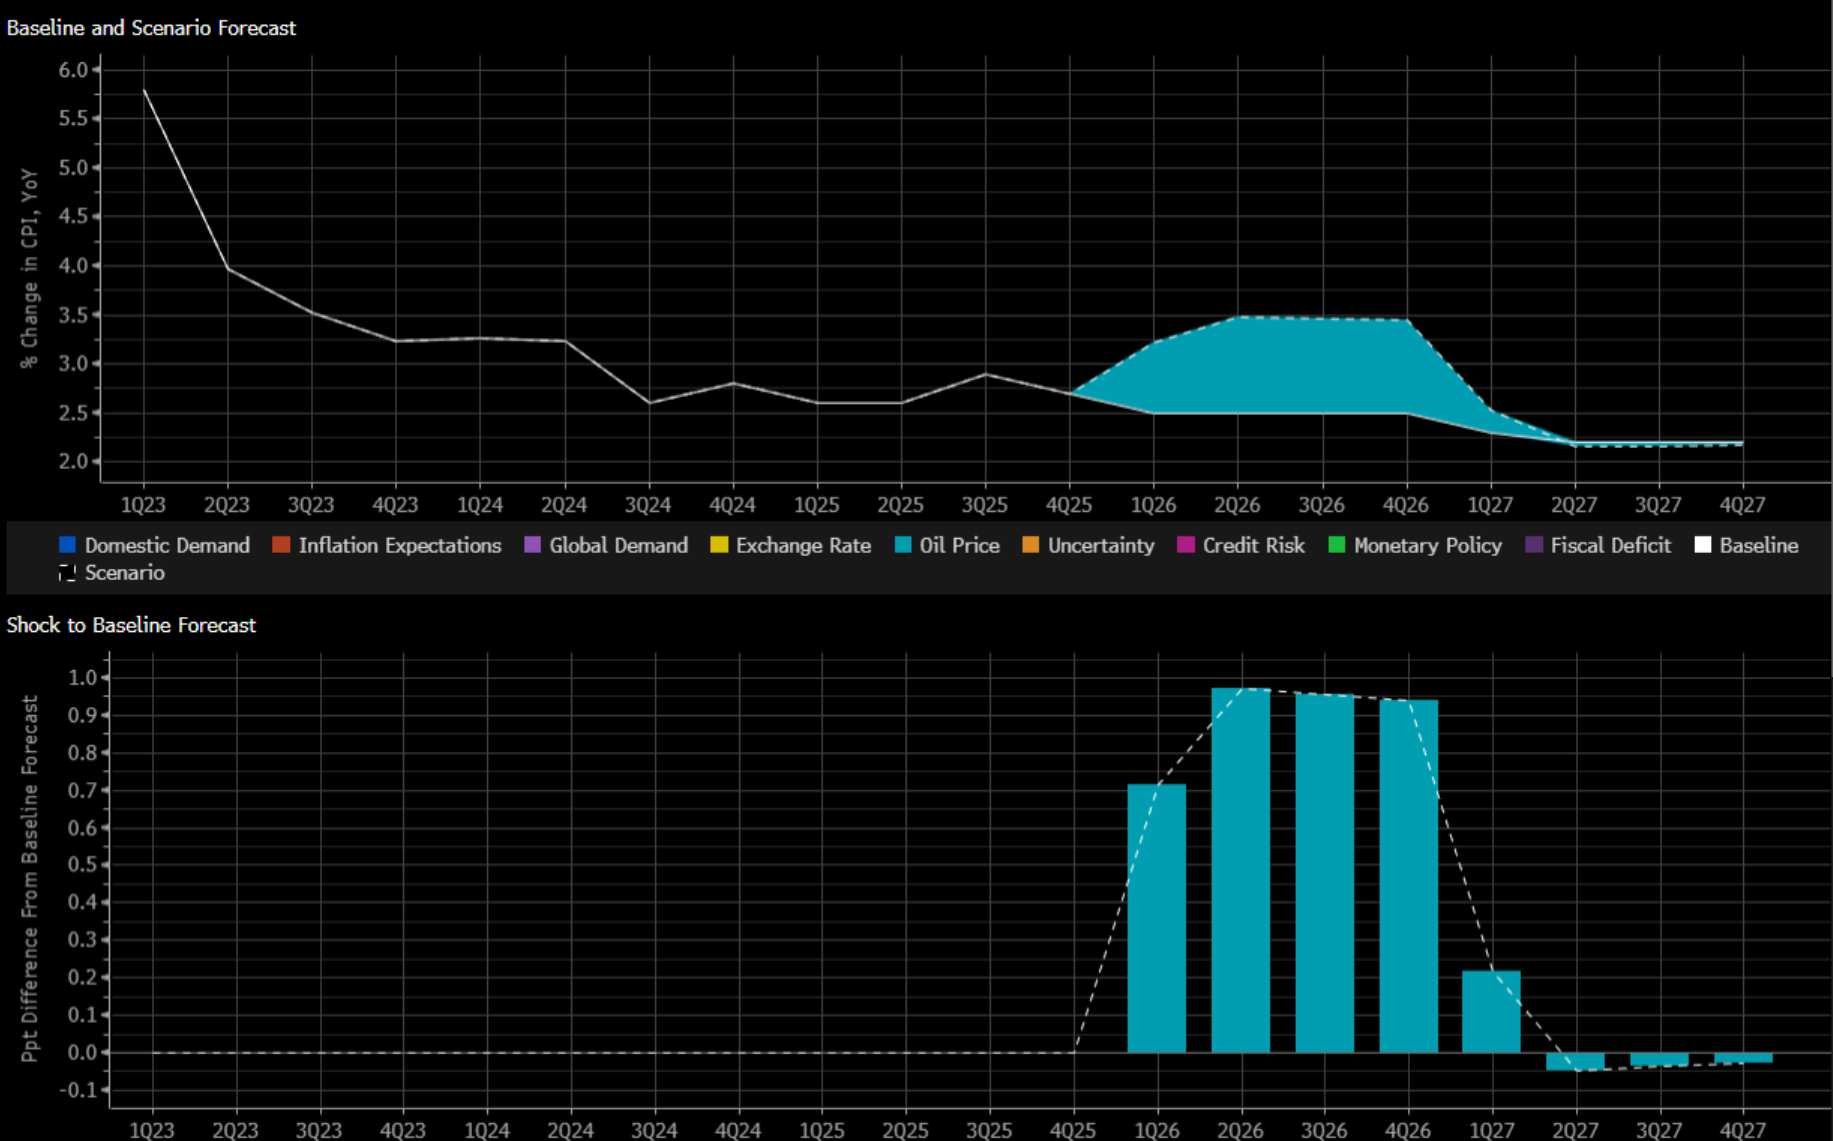
The simulated oil shock highlights a familiar but important dynamic: while higher energy prices create an immediate drag on activity, the overall impact on growth remains relatively contained.
In the near term, the increase in oil prices acts as a tax on the consumer and compresses margins, leading to a visible dip in growth relative to baseline. This initial slowdown is front-loaded, reflecting the sensitivity of consumption and business activity to higher input costs. However, the magnitude of the decline is modest, and the economy stabilizes relatively quickly.
What stands out is the limited persistence of the shock. After the initial hit, growth begins to normalize, with only a small and gradual deviation from the baseline path. This suggests that while energy shocks can disrupt momentum, they do not fundamentally derail the cycle under current conditions.
From a macro perspective, this reinforces the idea that the economy is more resilient to energy price volatility than in prior decades. Improved energy efficiency, a more diversified economic structure, and reduced reliance on external energy inputs have all contributed to dampening the transmission from oil prices to growth.
For rates markets, the implication is nuanced. The growth hit is not severe enough to trigger an aggressive repricing of the easing cycle, but it does introduce downside risks at the margin. At the same time, the inflationary nature of the shock through higher energy costs limits the ability of central banks to respond decisively.
The latest scenario highlights a different kind of energy shock—one that doesn’t hit immediately, but builds over time. In the near term, inflation continues to follow its baseline disinflation path, suggesting that underlying demand dynamics and anchored expectations are doing most of the work. There is little evidence of an immediate pass-through from higher oil prices, and the broader inflation trend remains intact through 2024 and into 2025.
That changes in 2026. Inflation begins to reaccelerate meaningfully, rising above baseline for several quarters. The move is material approaching a full percentage point at its peak and is driven almost entirely by energy. This is not a broad-based overheating story, but a classic cost-push dynamic where higher oil prices gradually filter through to consumer prices.
What stands out, however, is the lack of persistence. The inflation impulse fades relatively quickly, with inflation converging back toward baseline by 2027. There is little evidence of second-round effects, such as wage-price spirals or sustained pressure from domestic demand. In other words, the shock lifts inflation levels temporarily, but does not fundamentally alter the trajectory of the cycle.
From a macro perspective, this reinforces a key point: energy shocks today tend to be delayed and transitory rather than immediate and structural. For policymakers, the challenge is timing. Early in the cycle, the absence of inflation pressure may justify patience. But as the shock materializes, central banks may be forced to respond to a rise in headline inflation that was not initially visible in the data.
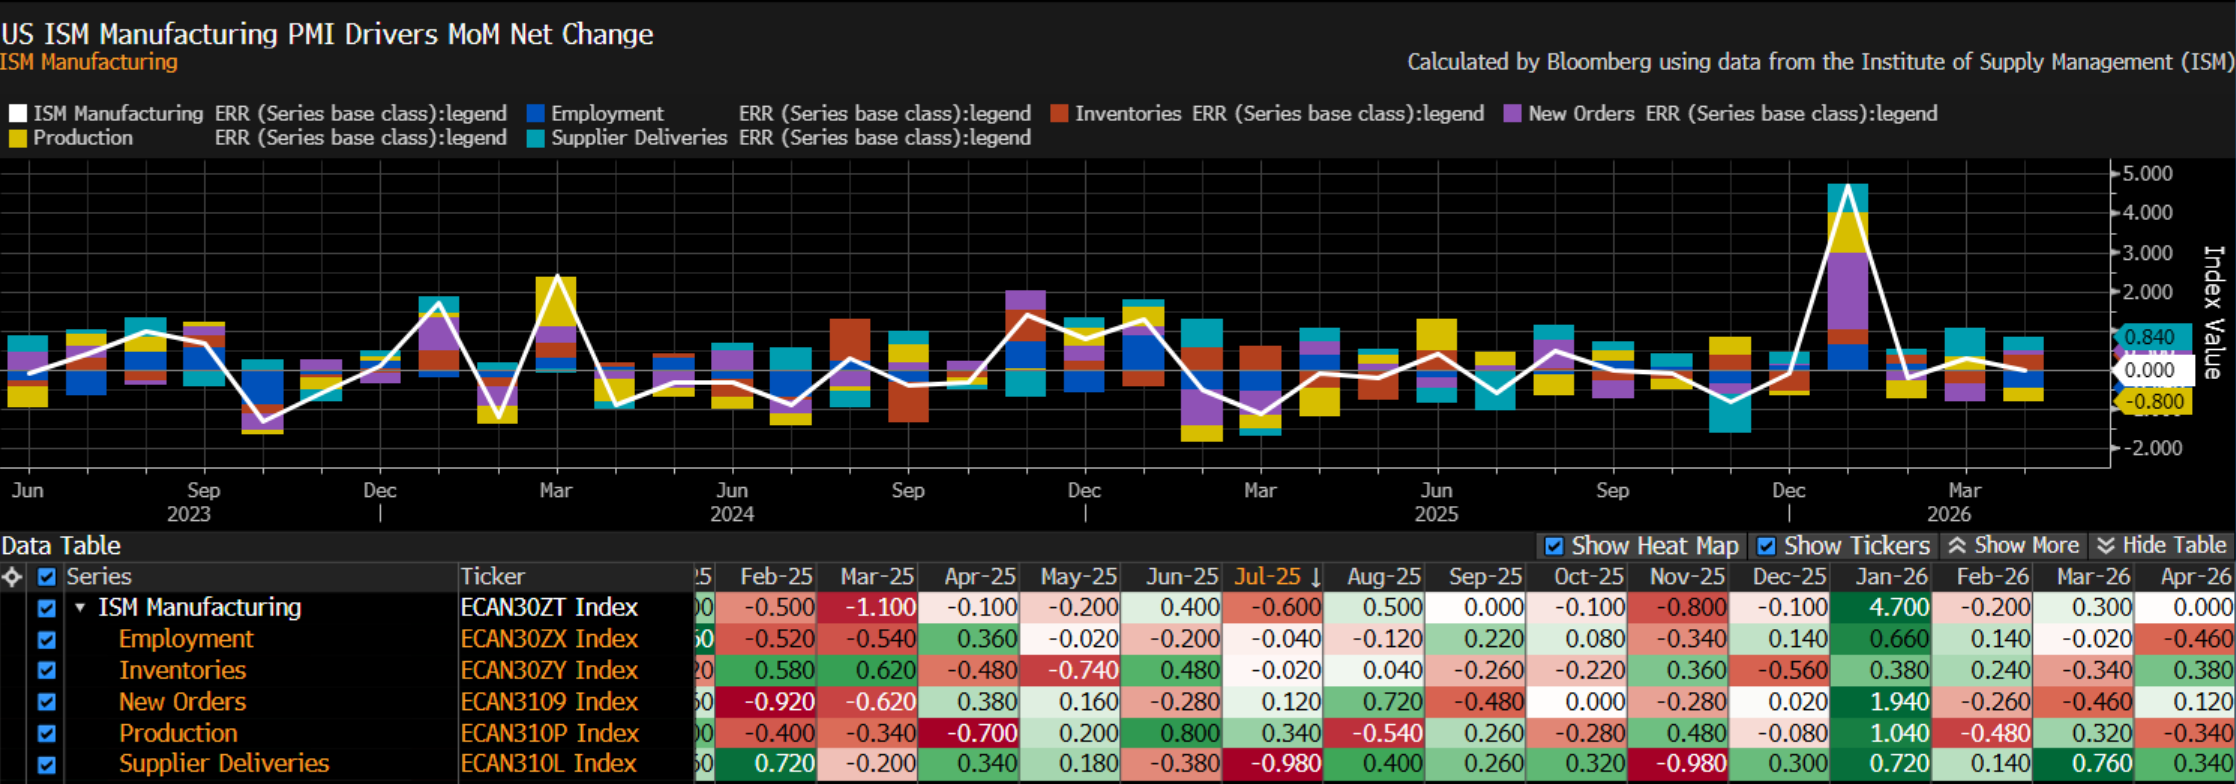
Price pressures were the standout feature of the April ISM Manufacturing PMI, with the prices-paid index reaching a four-year high. Slower supplier deliveries likely linked to geopolitical disruptions helped lift the headline figure. While new orders picked up, demand was not as strong or broad-based as expected, and both production and employment weakened. Overall, more weight is being placed on the softer orders, output, and labor data than on the improvements in inventories and supply constraints.
Overall GDP forecasts remain optimistic on the United States economy which I agree with the underlying structure of the economy remains resilient.
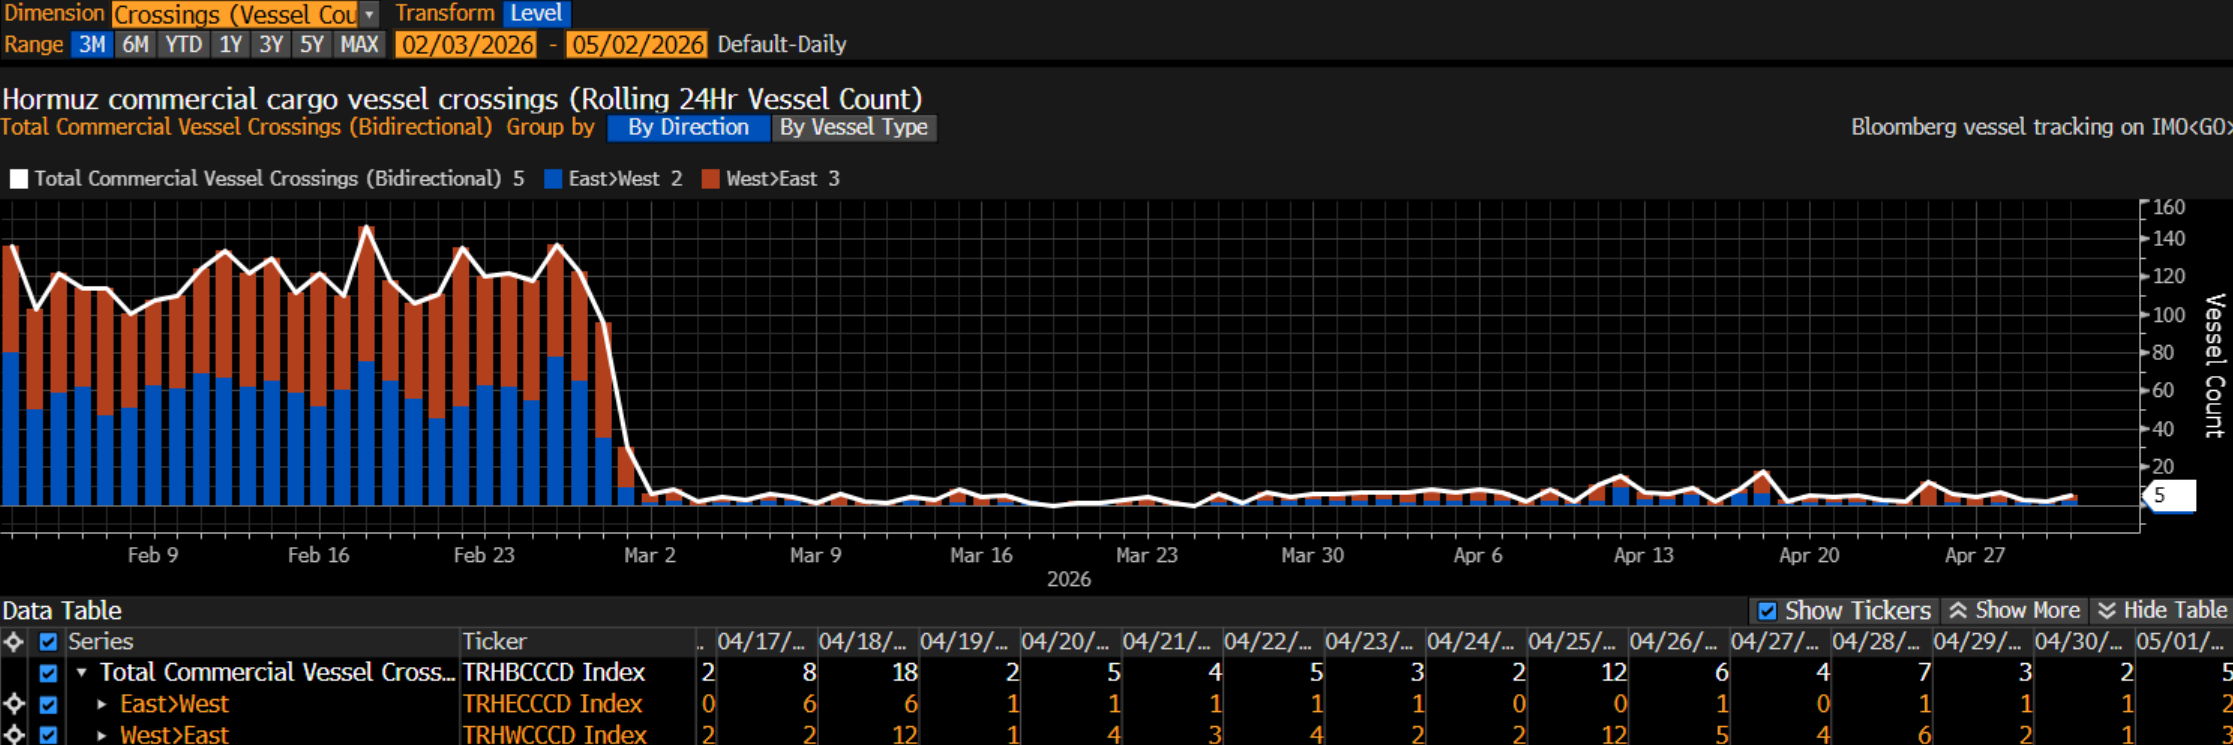
On the geopolitical front nothing has really changed as it relates to the Strait of Hormuz.
Credit
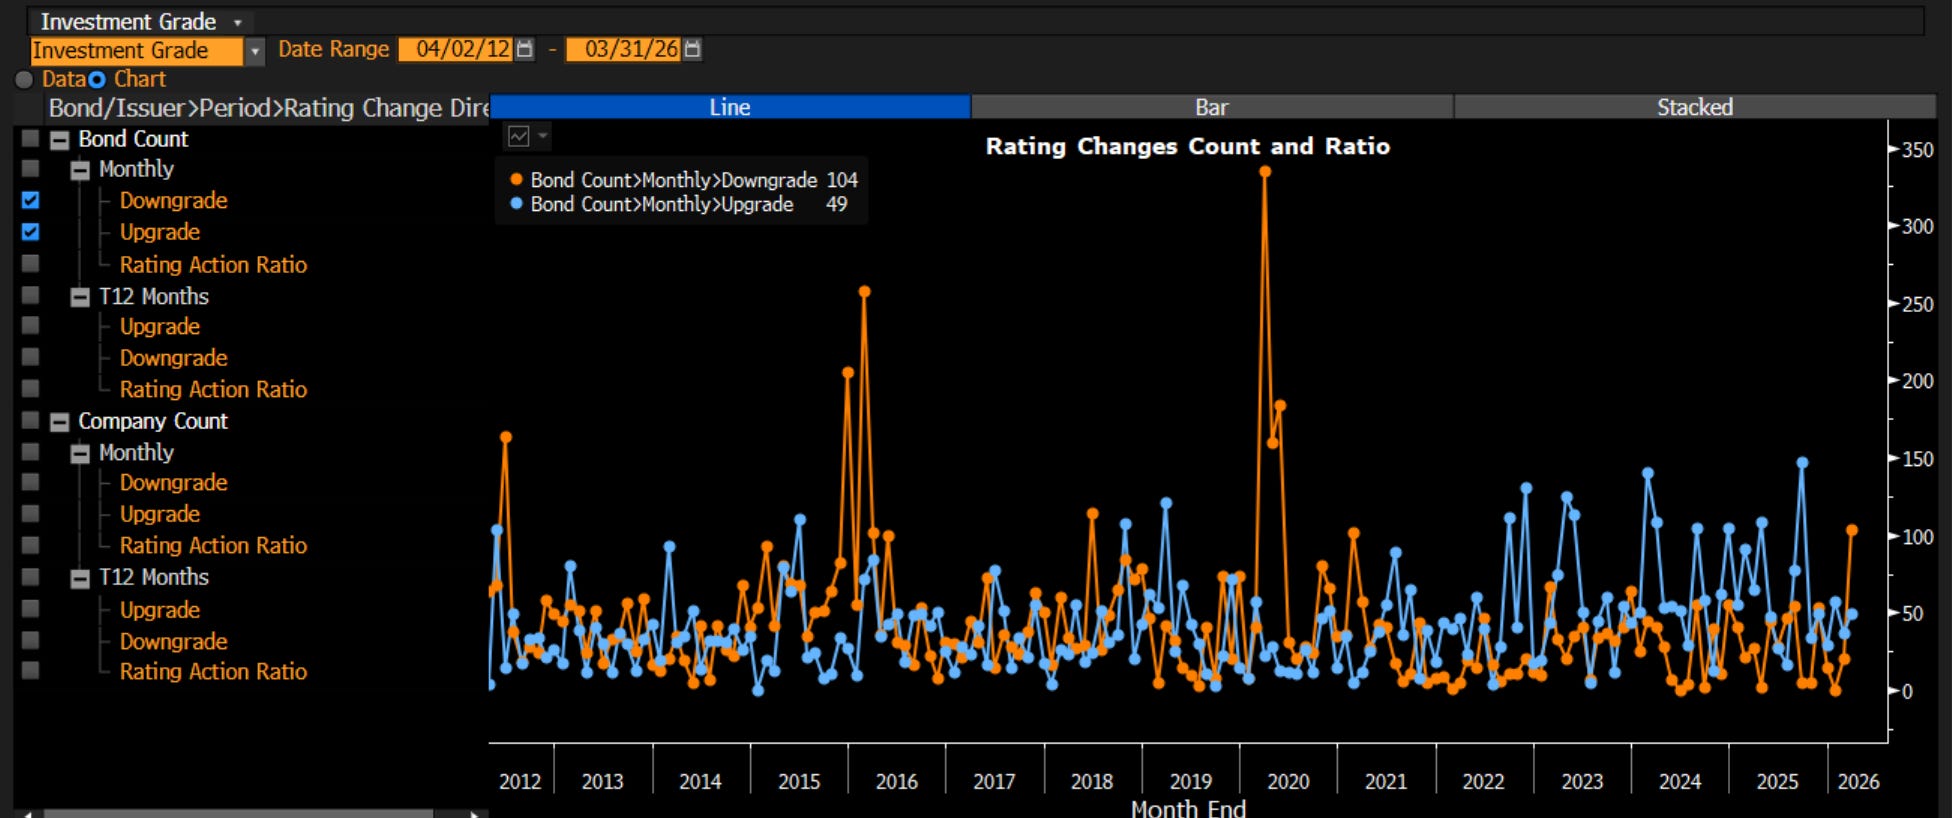
As we stand today, investment grade credit is showing early signs of fatigue. Downgrades are now outpacing upgrades, marking a clear shift from the post-pandemic repair phase to a more pressured environment.
This isn’t a systemic stress event like 2020, but it does reflect the lagged impact of tighter financial conditions. Higher rates over the past two years are now feeding through to balance sheets, with refinancing costs rising and interest coverage gradually weakening. The upgrade cycle has effectively rolled over.
What’s notable is that the deterioration remains orderly. We’re not seeing the kind of sharp, volatility-driven downgrade spikes associated with crisis periods. Instead, this is a slow grind more consistent with late-cycle dynamics than an abrupt downturn.
From a macro lens, this aligns with a backdrop of still-restrictive real rates, moderating growth, and less supportive liquidity conditions. The cushion that previously came from easy refinancing and strong nominal growth has faded.
In short, investment grade credit has moved out of recovery and into a phase of gradual pressure where fundamentals matter more, and the direction of travel is no longer improving.
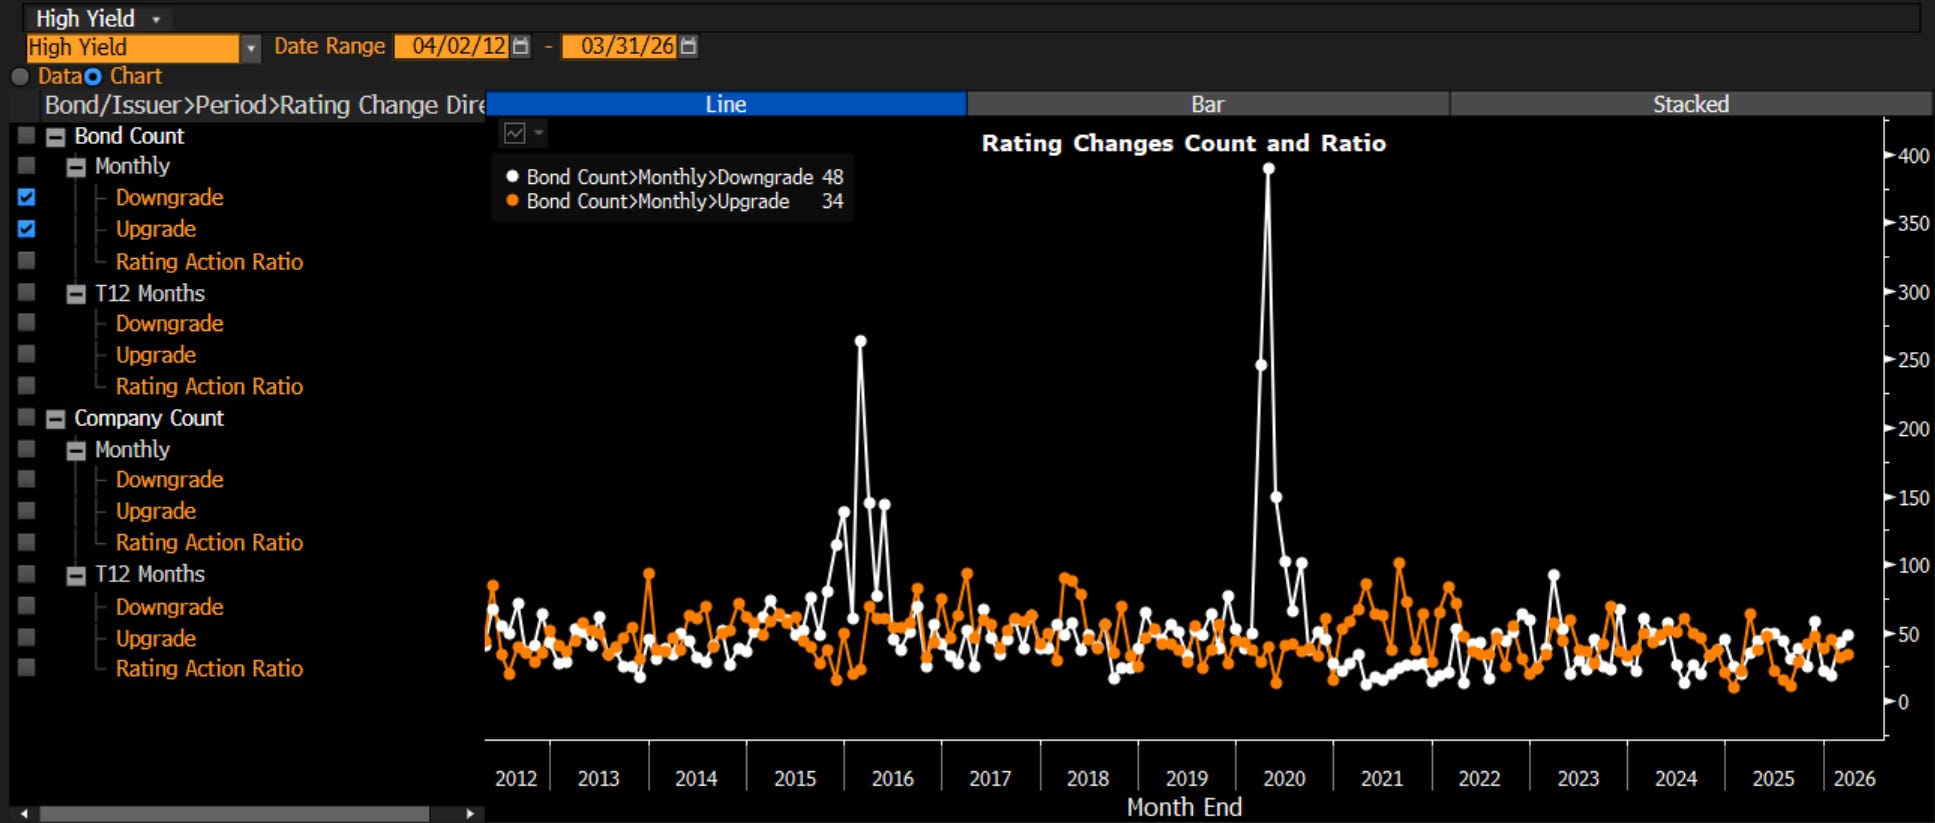
In high yield the absence of extreme spikes suggests this isn’t a disorderly credit event. Instead, it reflects a steady deterioration consistent with tighter financial conditions working through the lower-quality segment of the market. Higher funding costs and weaker interest coverage are weighing more heavily here than in IG.
What stands out is that the upgrade cycle never meaningfully re-accelerated post-2021. Unlike investment grade, where balance sheets were largely repaired, high yield issuers remain more vulnerable to even modest macro headwinds.
From a market perspective, this reinforces the idea that credit risk is building from the bottom up. The cycle is not breaking but it is clearly softening, and high yield is where that softening is most visible.
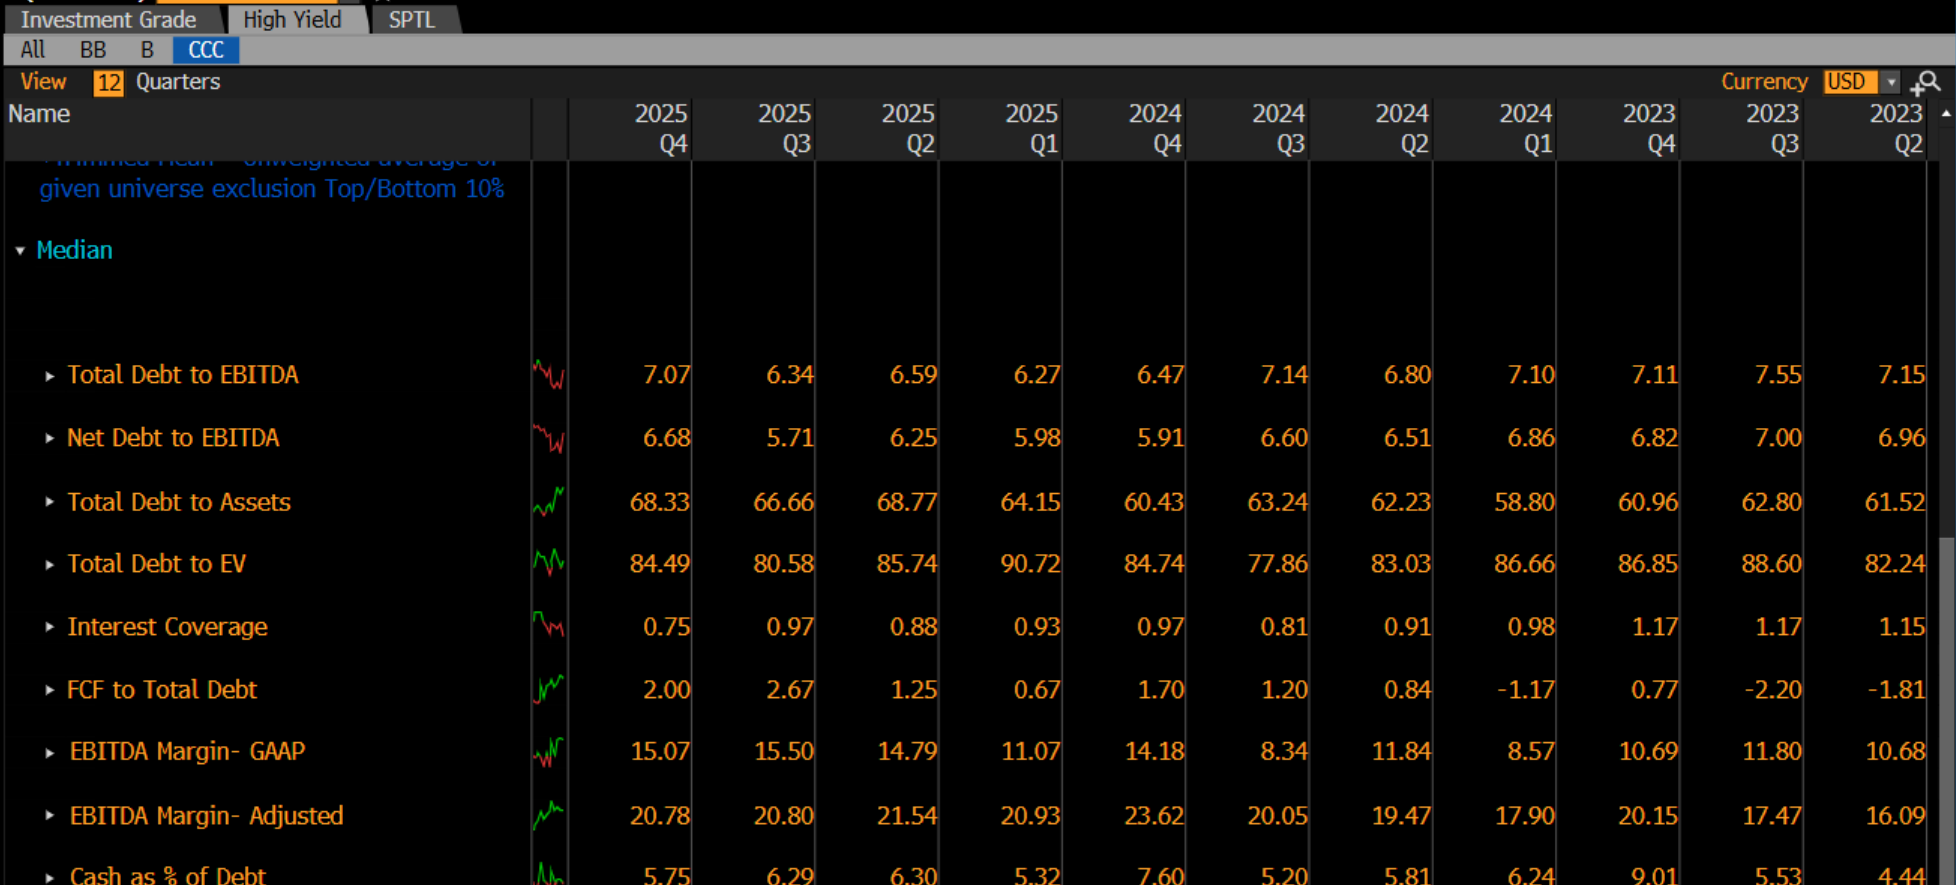
Gross Debt-to-Ebitda was higher last earnings season with the 7.07x median leverage for CCC High Yield. Interest coverage continues to decline in the high yield space with 0.75x coverage the worst in almost a decade.
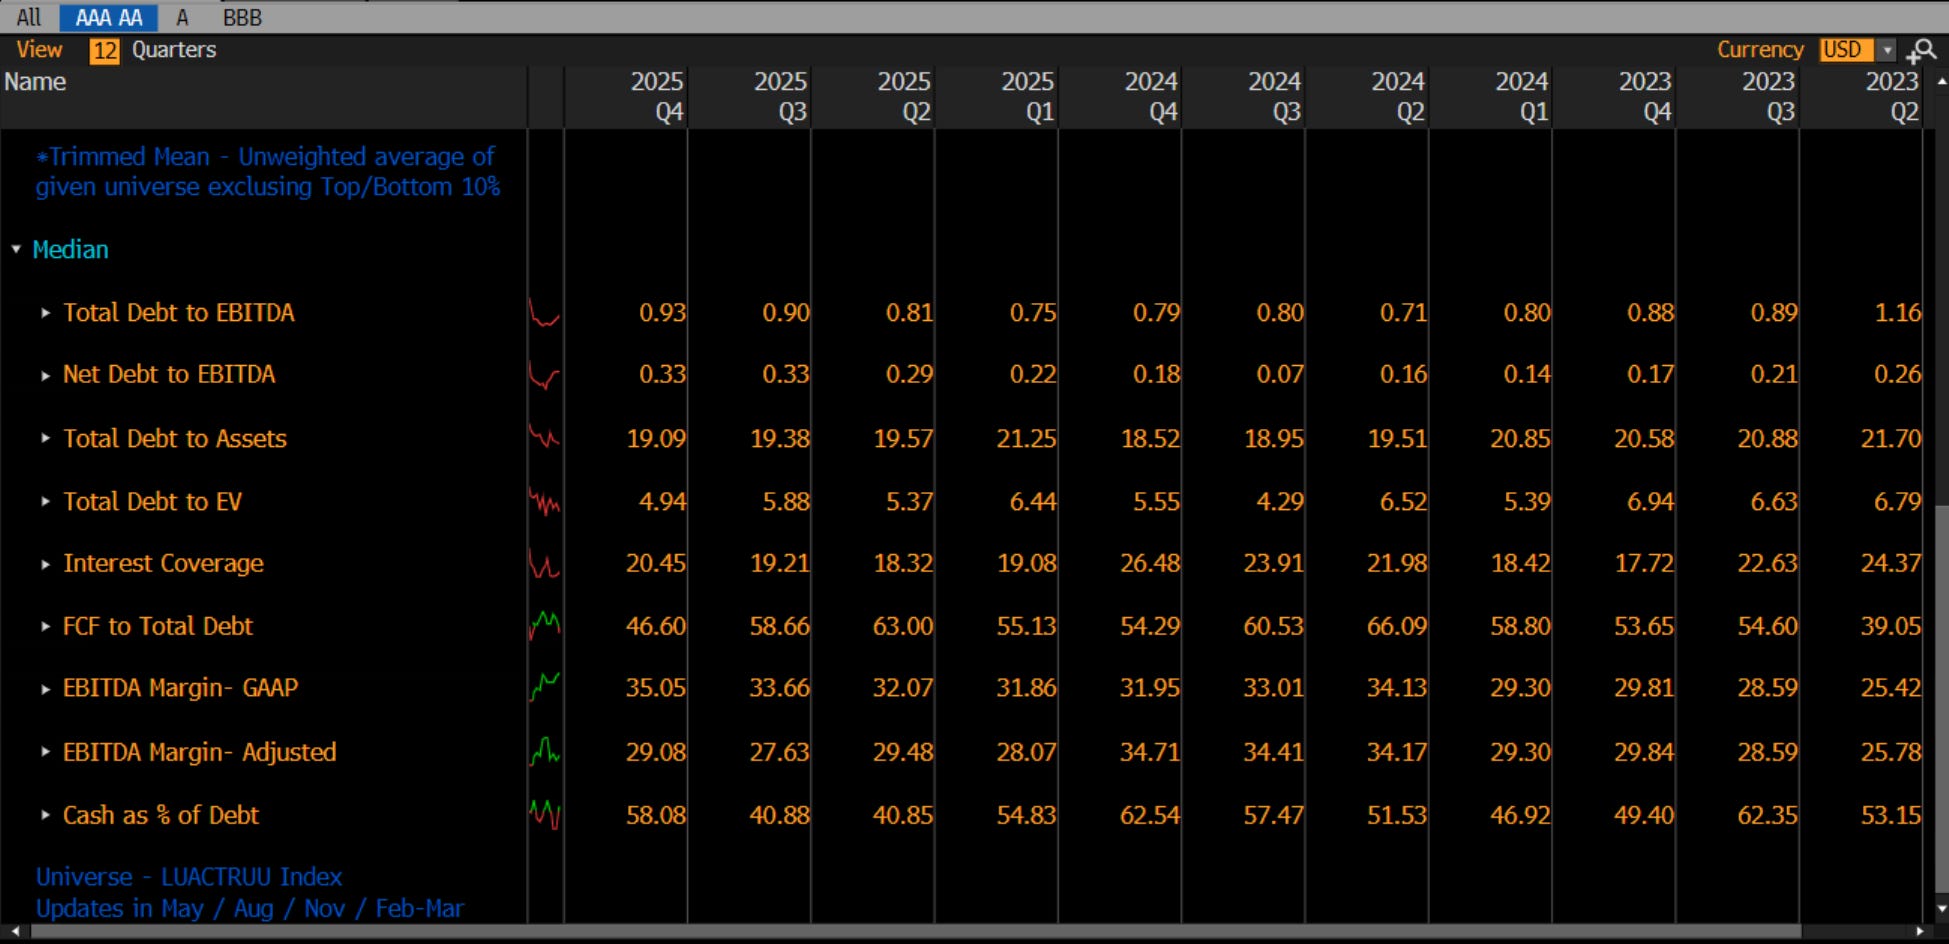
The opposite remains true at the top end of investment grade. For AAA and AA issuers, balance sheets remain exceptionally strong. Total debt to EBITDA sits around 0.93x, while interest coverage is 20.45x, underscoring just how insulated these firms are from higher rates.
This matters. Even after the sharp rise in yields over the past cycle, these companies are not feeling meaningful stress. Much of their debt was termed out at low coupons, and cash flow generation remains robust. As a result, refinancing risk is minimal, and higher interest costs are largely absorbed without pressuring credit quality.
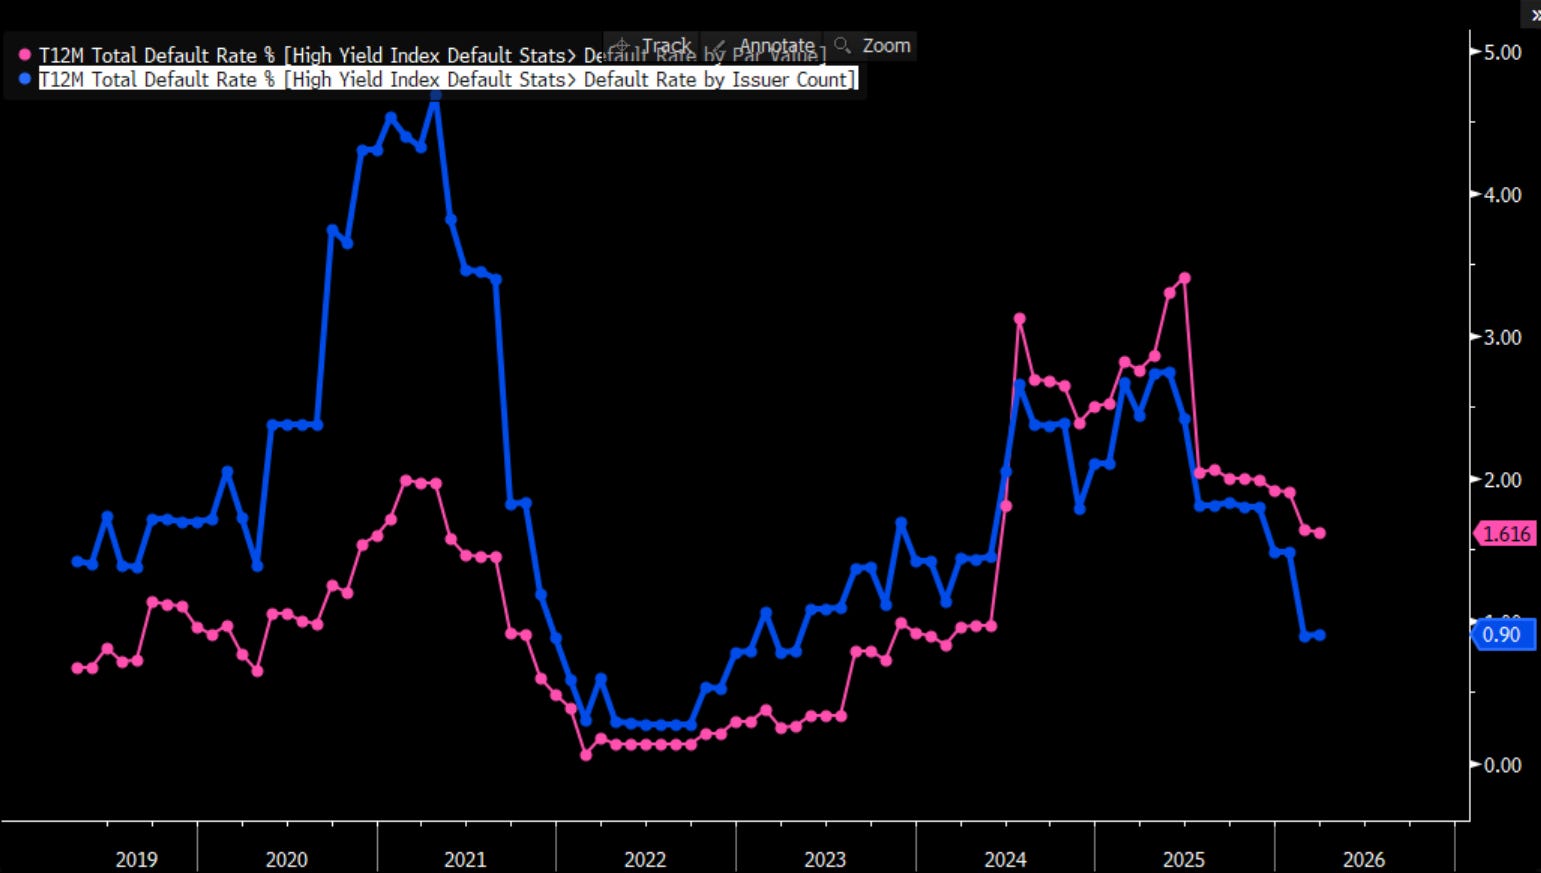
In Europe the high yield default rate fall by 30 bps by par from 1.9% to 1.6%. Junk distress (OAS above 2000 bps) is at 1.9%, well below the +4% peak in 2024, Euro High Yield Index is not priced for defaults. Going through 2026, do not see much more default risk priced in Europe.
Yield Gap (150 bps) should help continue to drive reverse Yankee supply:
Reverse Yankee issuance is being driven by the EUR–USD yield gap, with basis acting as an accelerator.
Natural hedgers issue on cheaper € funding directly, while swap-driven issuers rely on tight xCcy basis to lower all-in costs together fueling the surge in € supply.

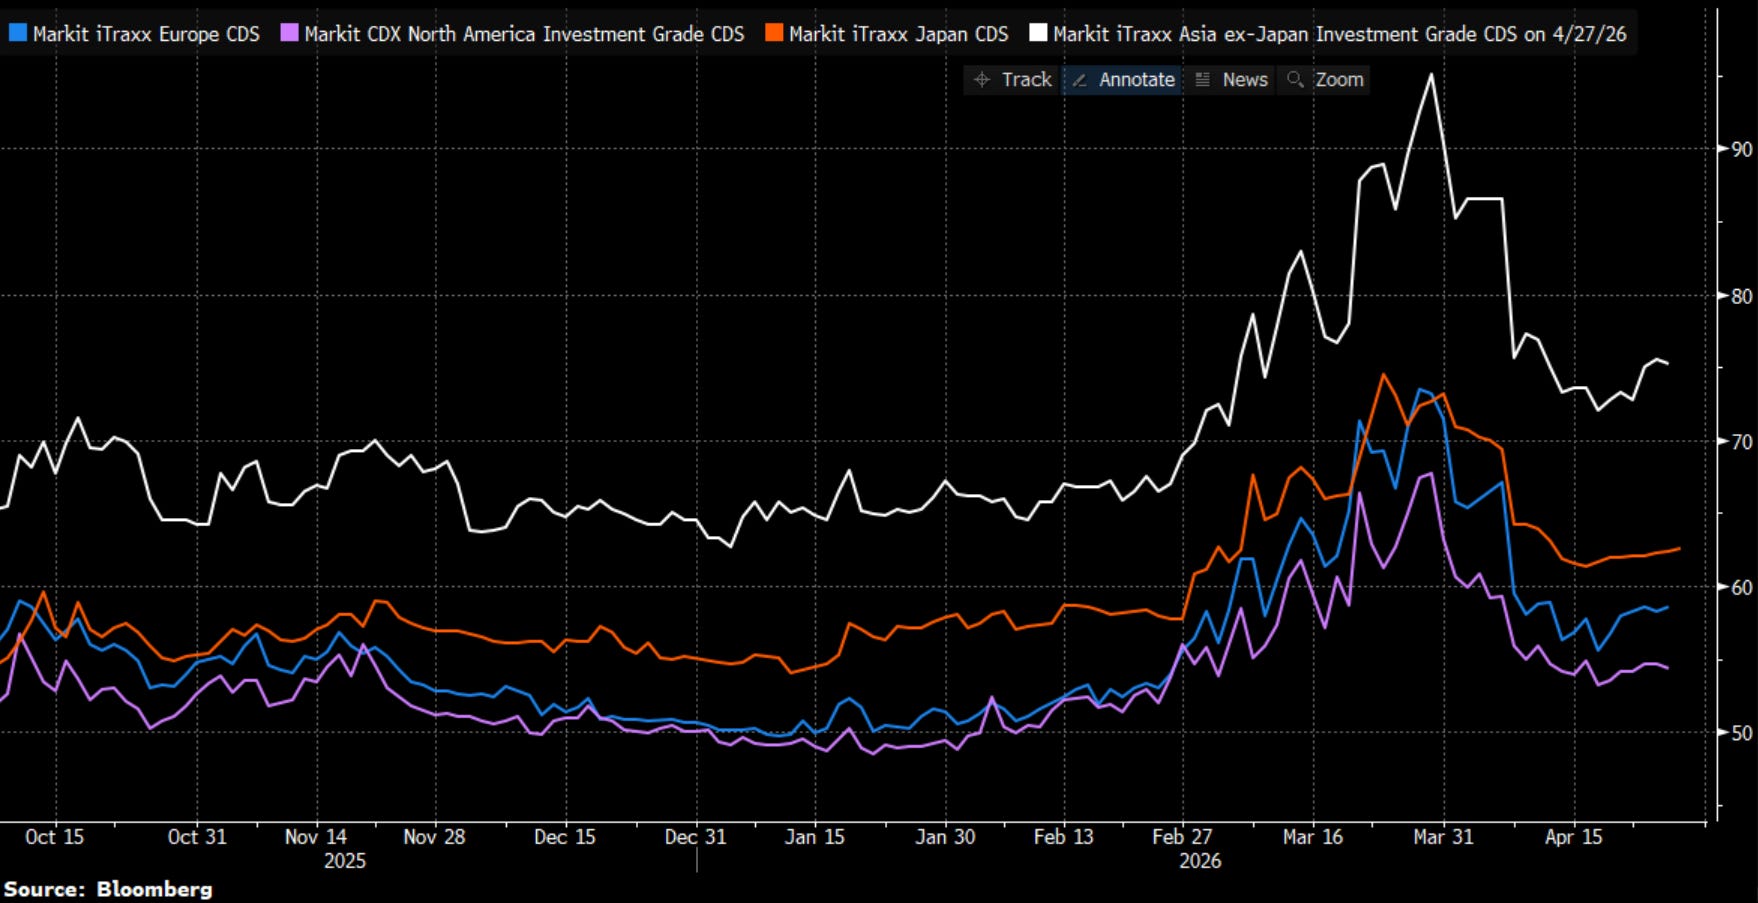
At the beginning of the conflict, we saw a selloff in risk assets that pushed credit spreads higher as investors digested the geopolitical tensions. Credit spreads on Asian high-grade dollar bonds widened the most in five months at the onset of the conflict and have since tightened. However, the breakdown of the ceasefire and the potential for renewed escalation could cause credit indices to widen again.
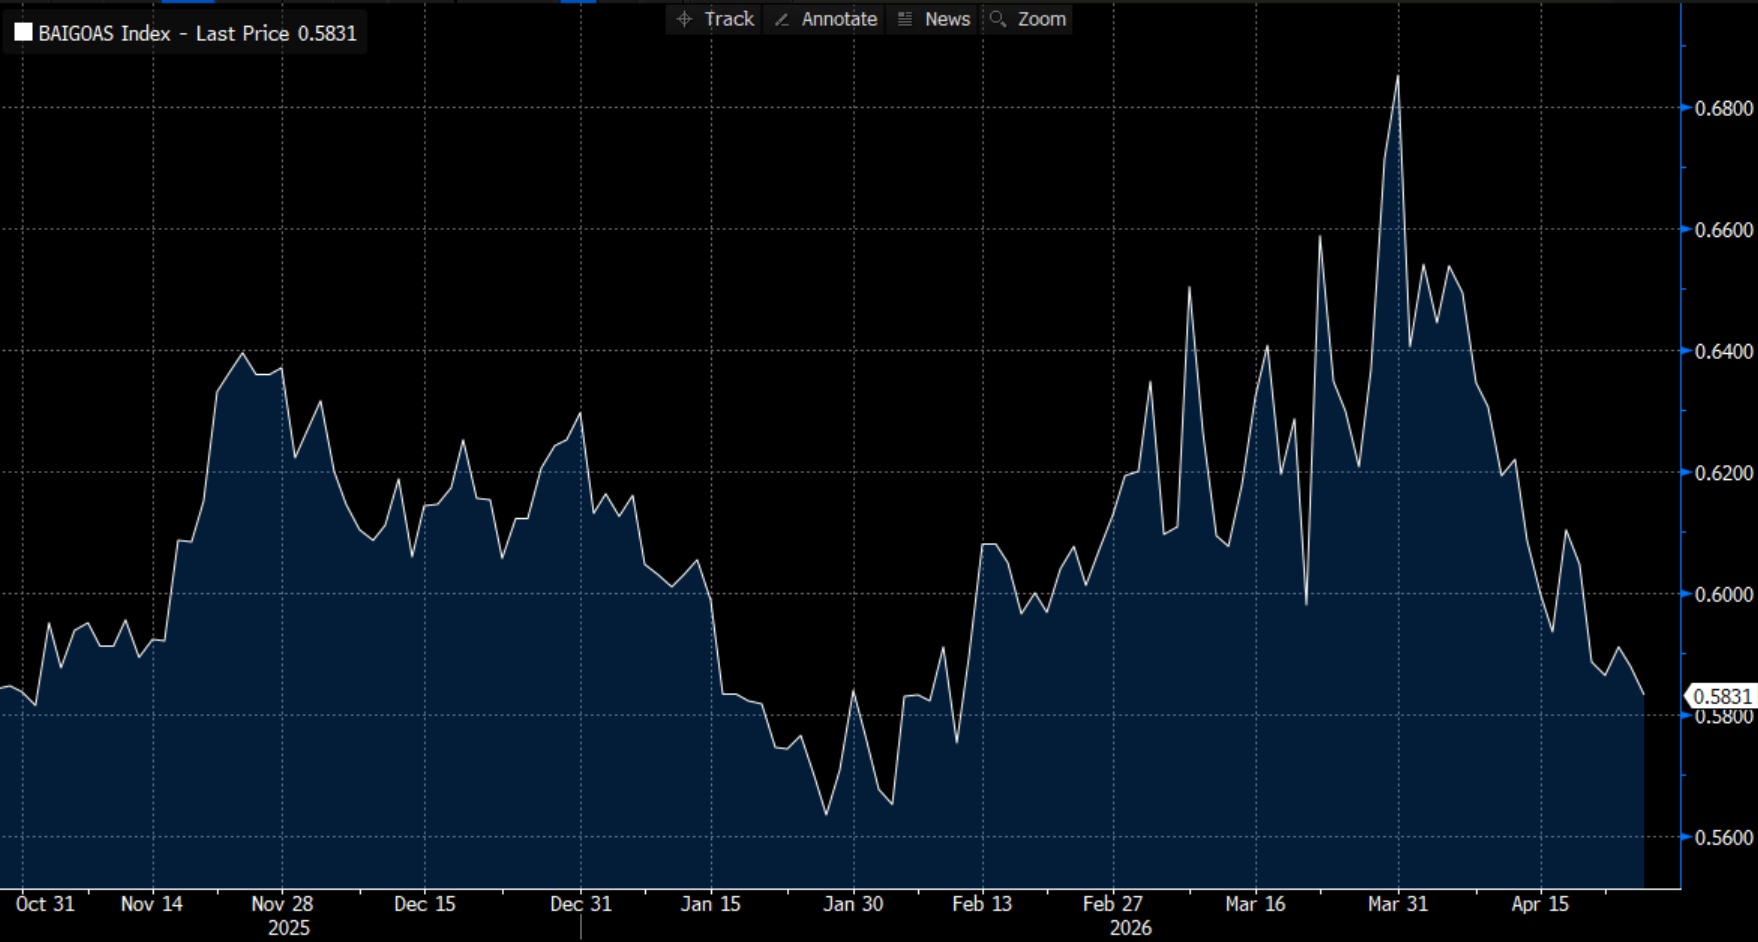
On the back of this global credit risk, we have seen IG credit fear gauges drop. Overall looking at Europe, Japan, and Asia (most dependent on energy imports) higher oil prices and concerns about those prices weakening balance sheets, and increase repayment risk have faded. Thus the cost of protection against corporate defaults, has started to somewhat stabilize.
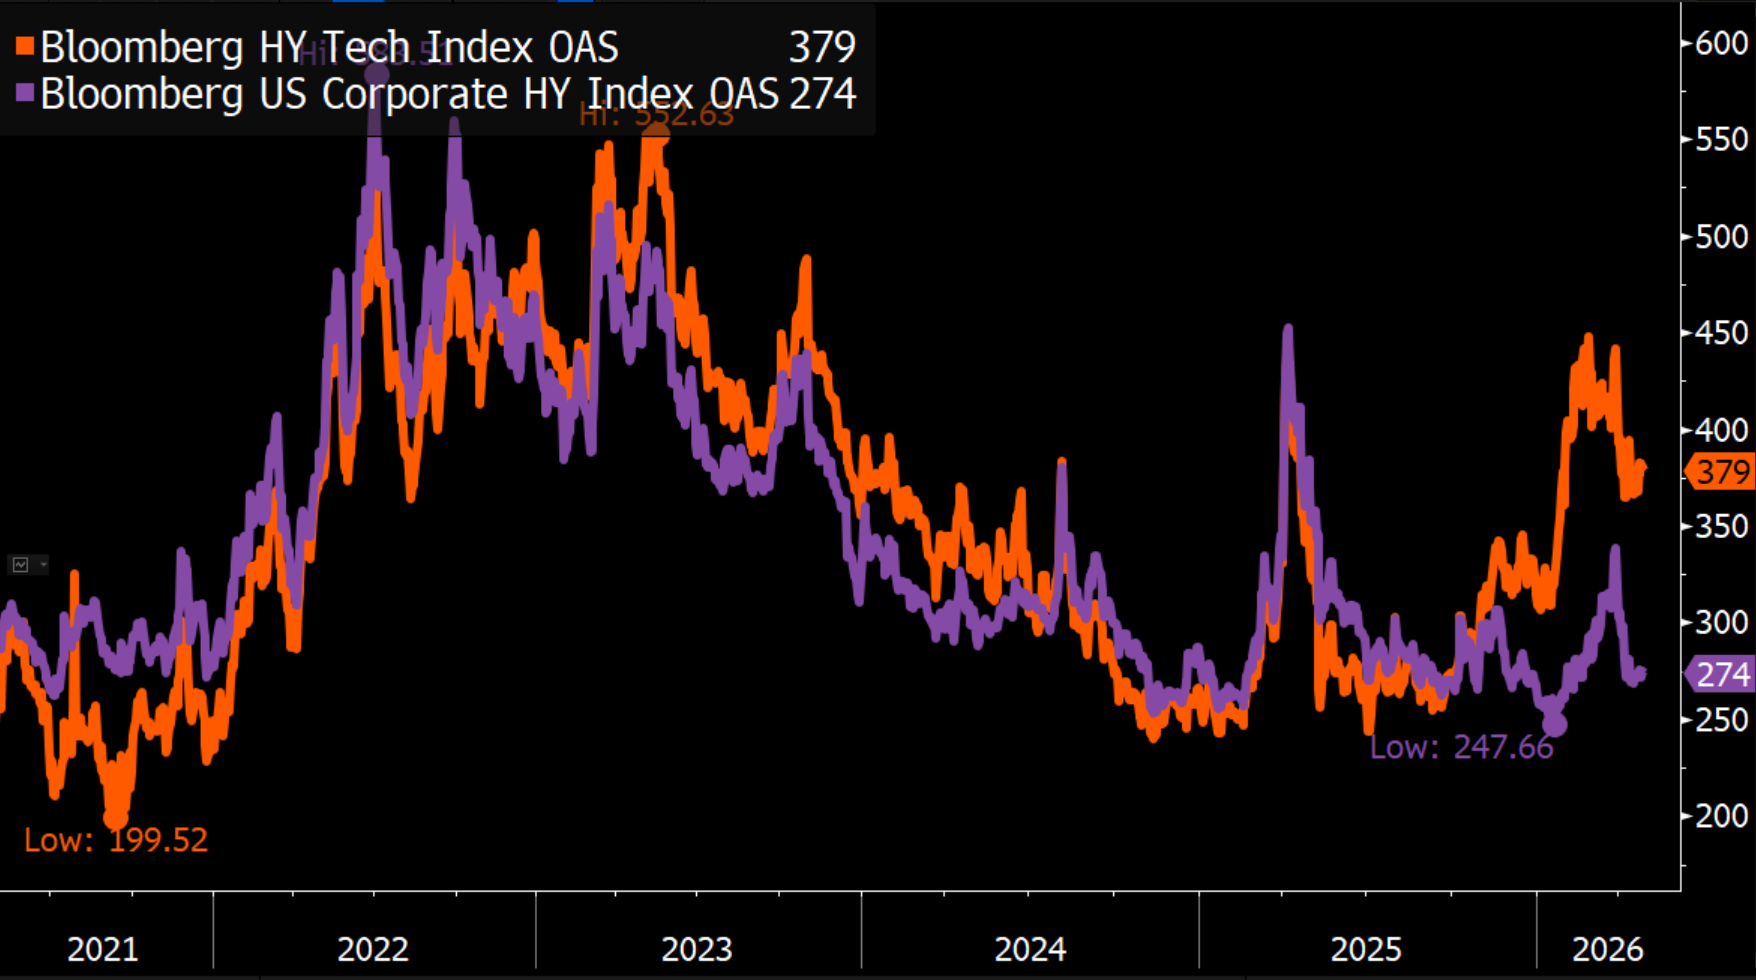
HY tech has started to see spreads widen again widening by about 19 bps.
FX
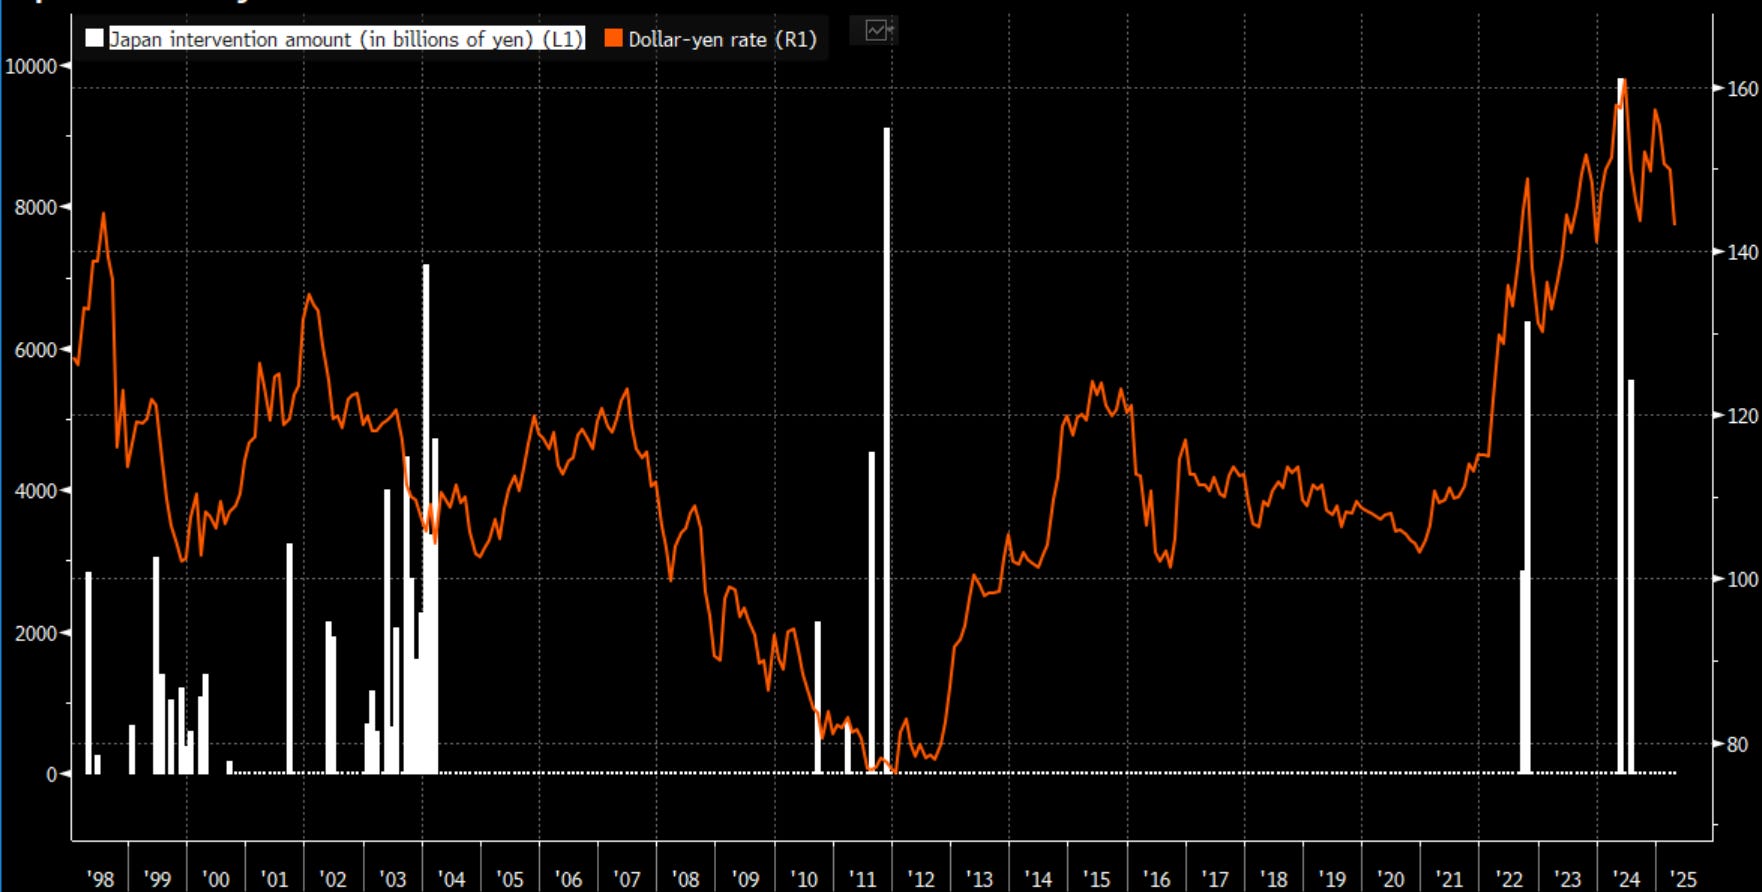
The Yen surged today, after Japan intervened in the FX market, and give a staunch warning to investors against selling yen. Per Nikkei newspaper, citing a government official, the government bought yen and sold dollars.
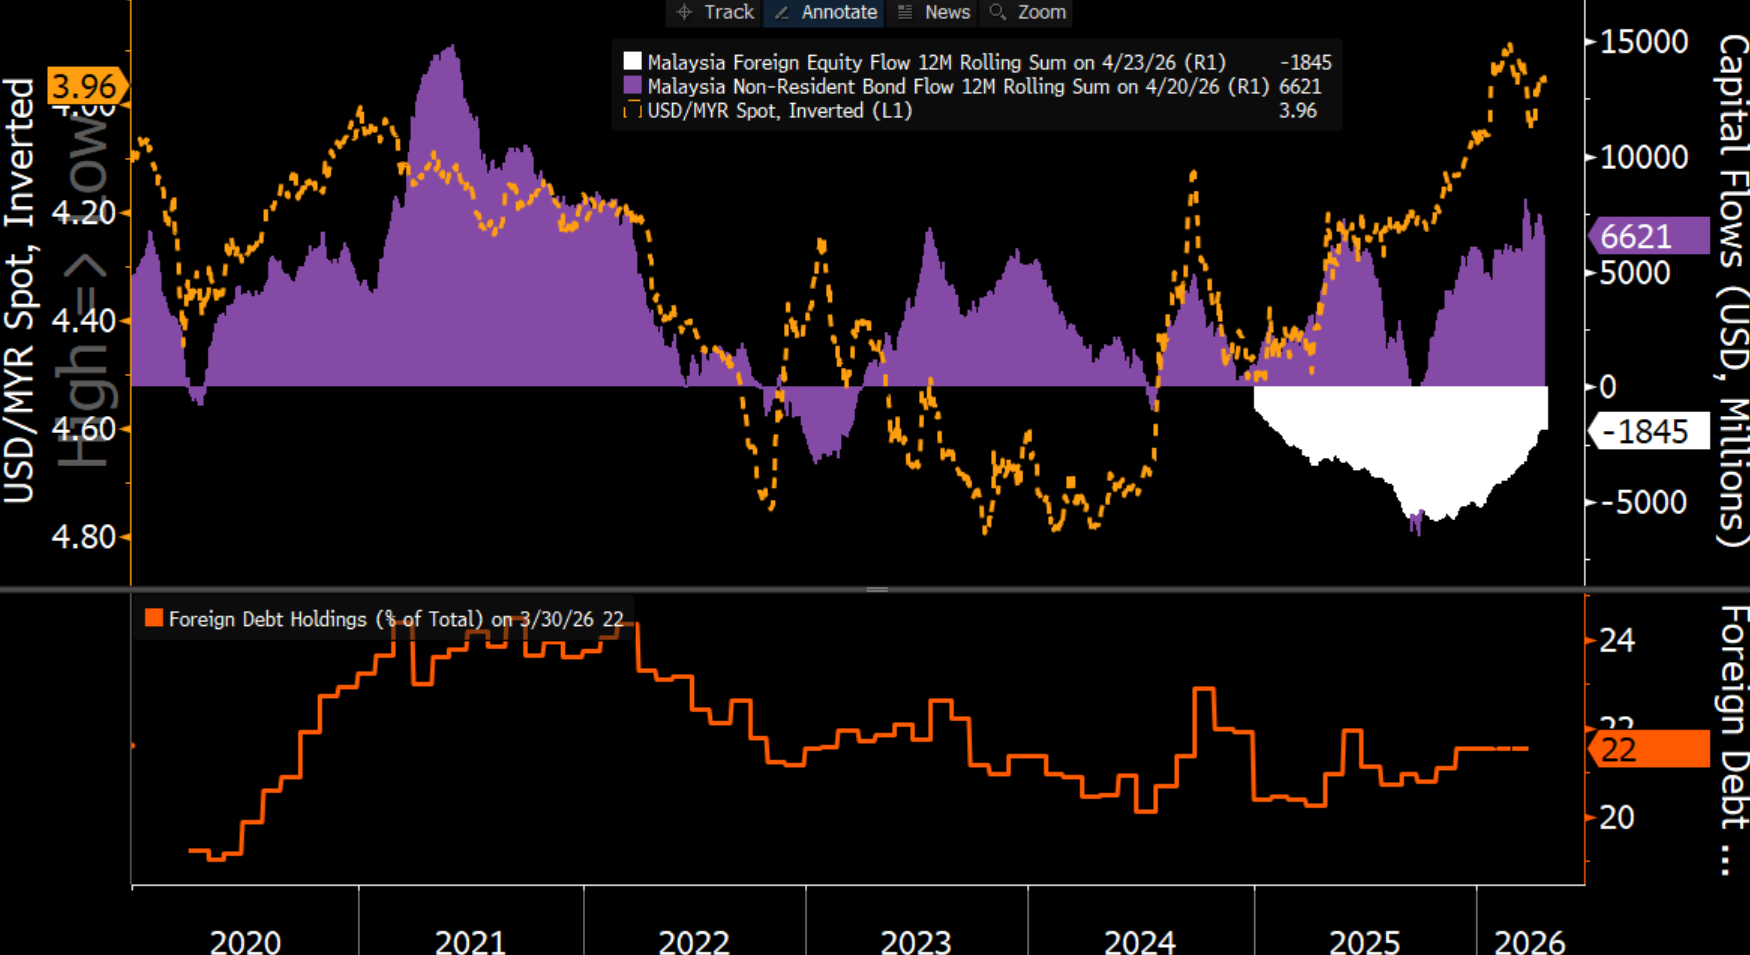
Ringgit is benefitting from foreign capital. The current easing path from BNM compared with the Fed, could position yield-differentials to favor the ringgit. Foreign holdings of Malaysian bonds are currently at 22% of total debt. With bond flow being relatively strong as of late the ringgit should continue to stay bid.
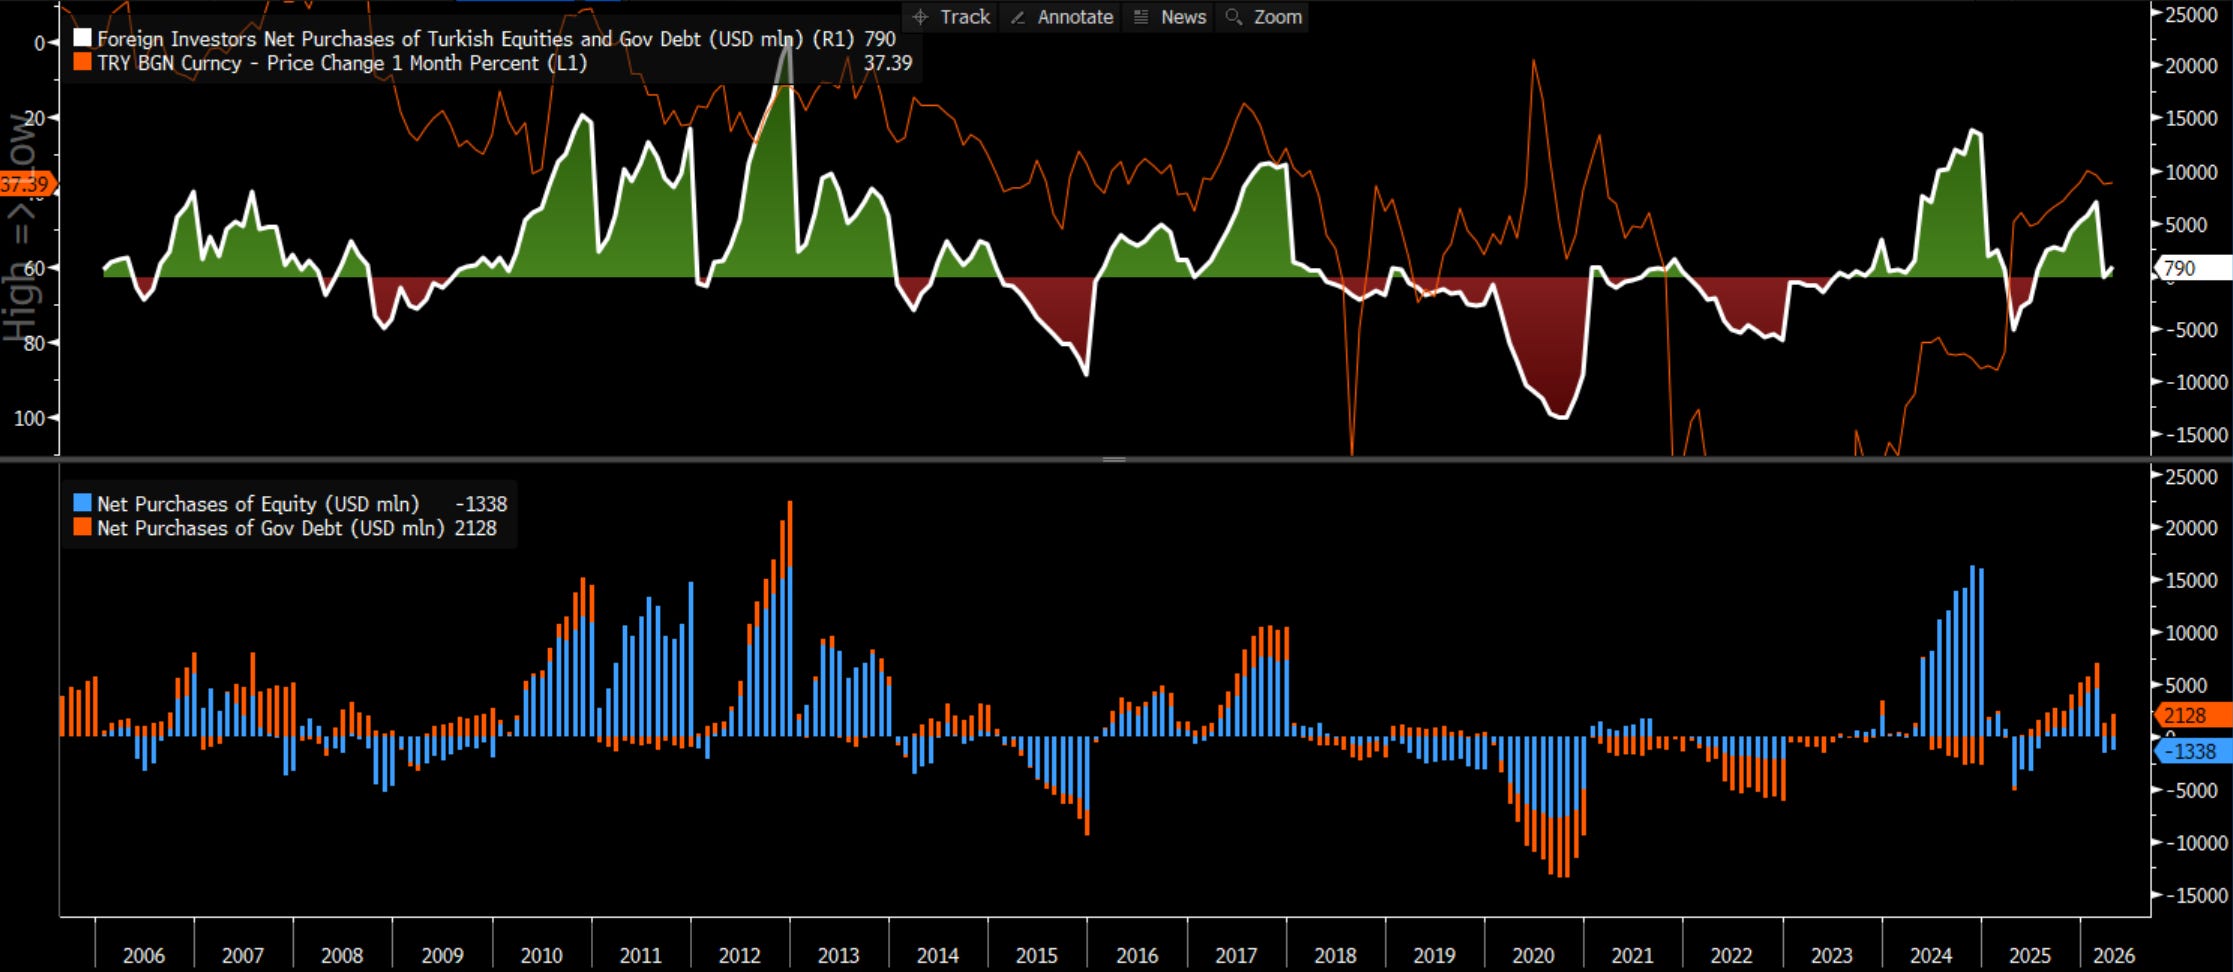
Foreign flows into Turkey remain tactical, with investors rotating in and out of equities and government debt rather than committing long-term capital. Currency stability continues to anchor positioning, TRY weakness consistently triggers outflows, while periods of stability attract selective inflows, primarily into high-yielding government bonds. The latest data suggests cautious re-engagement, but investors are still trading Turkey’s yield, not buying into a durable macro story.
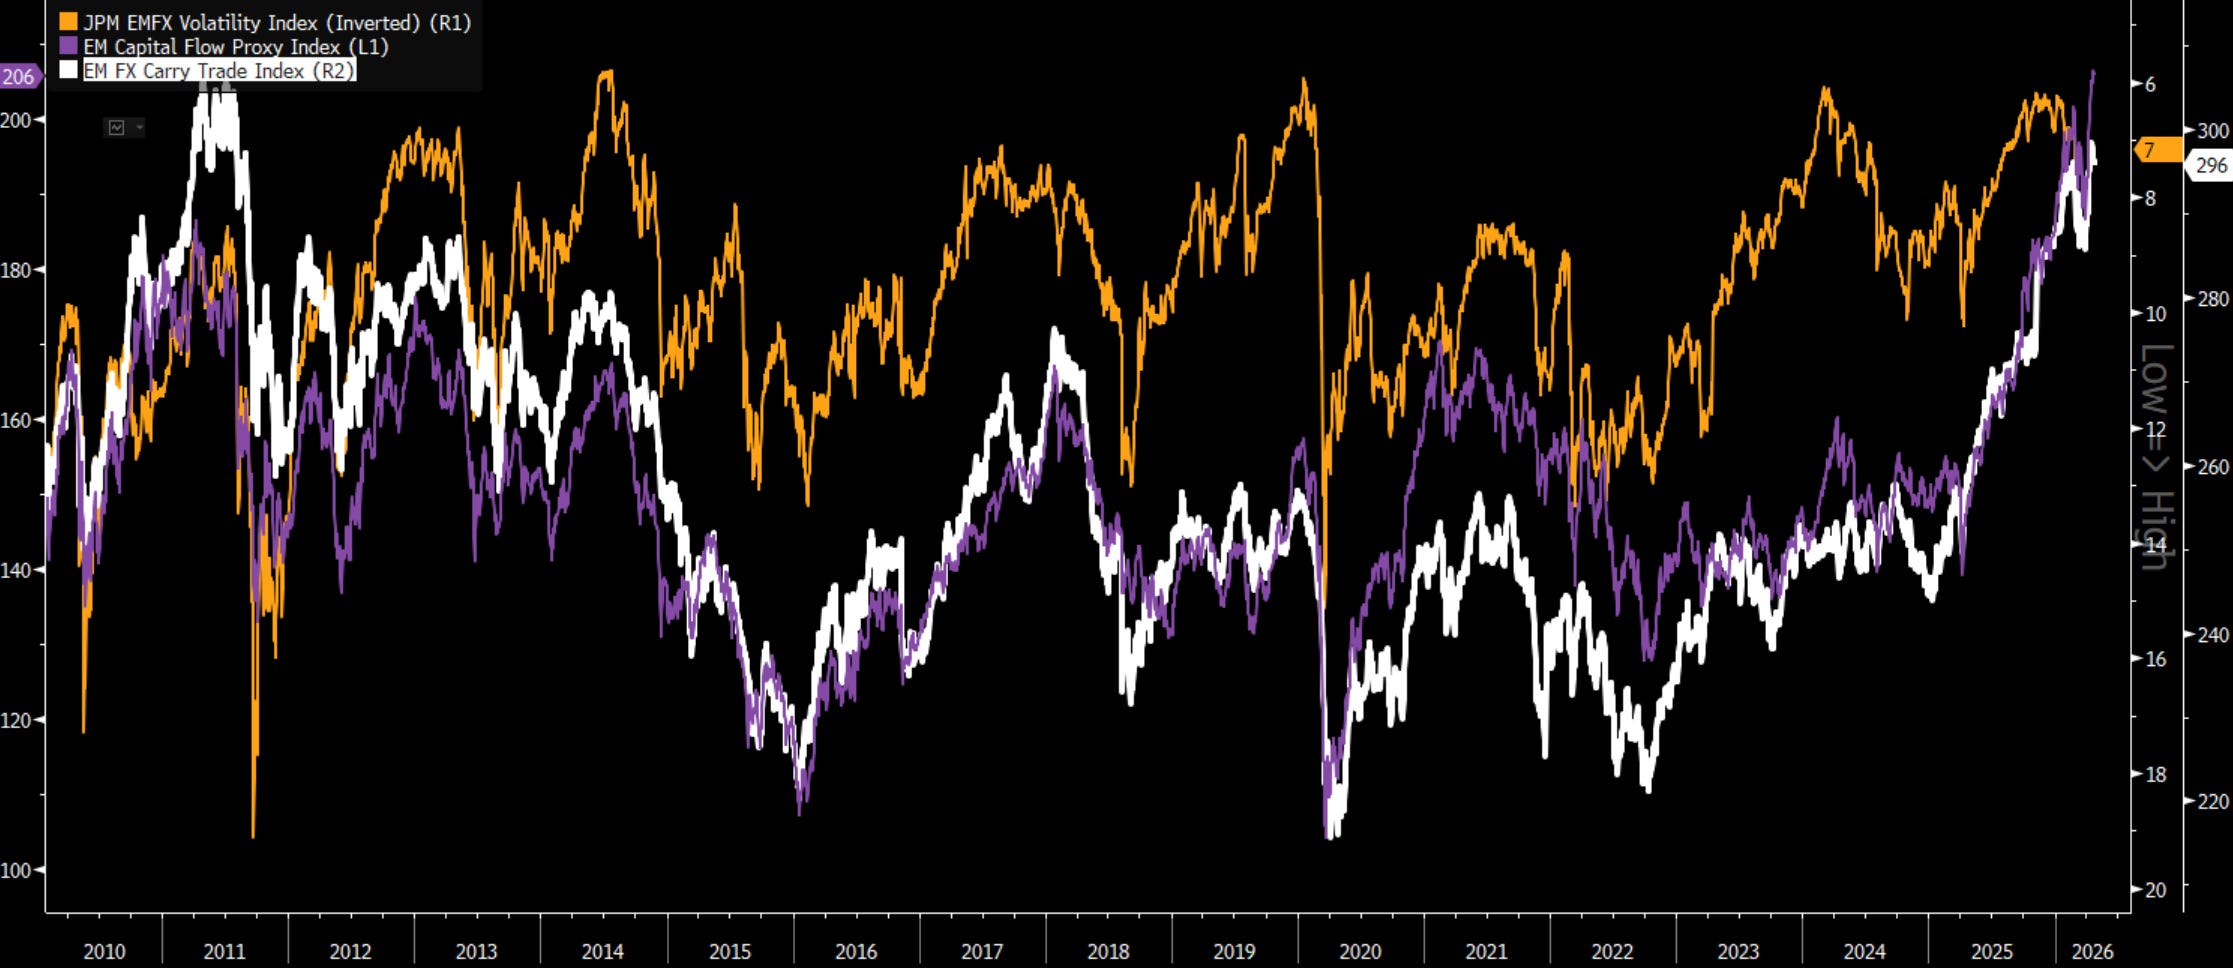
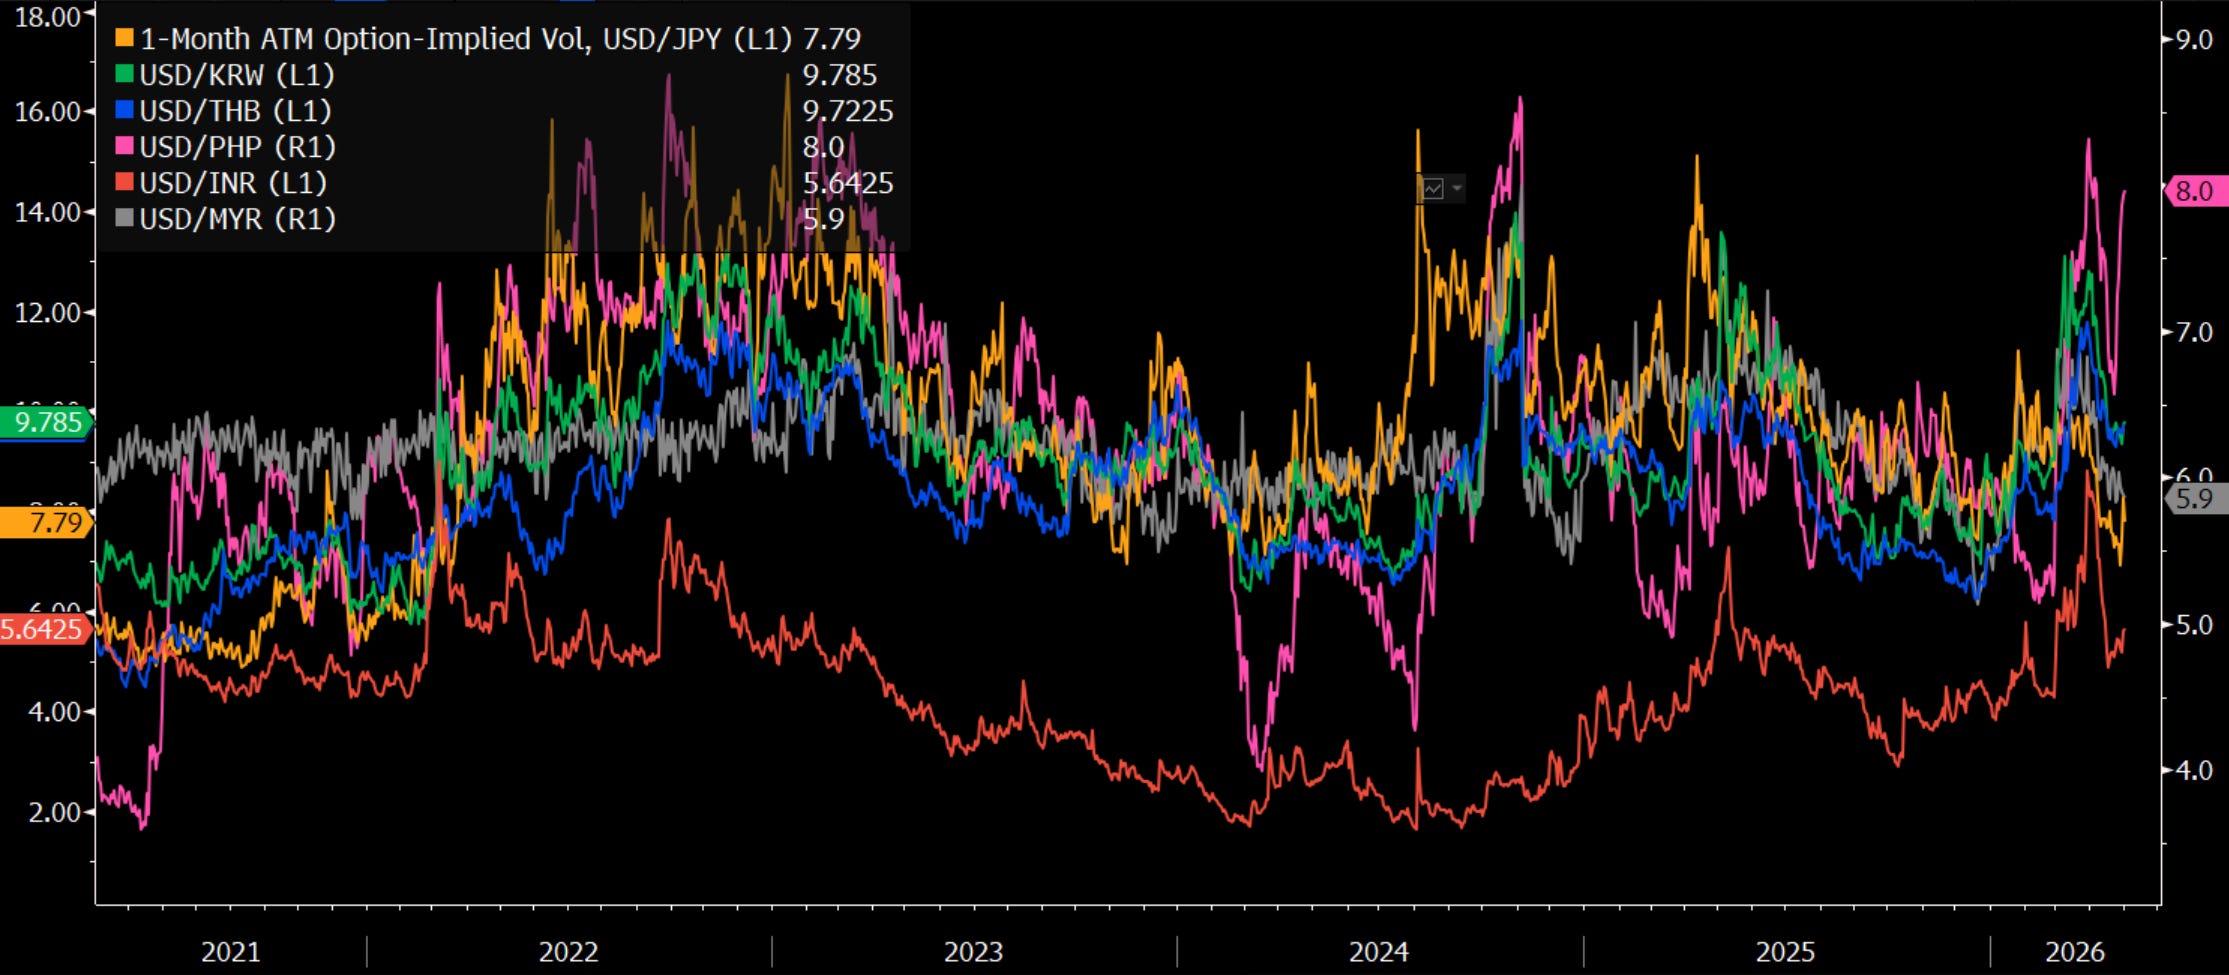
The backdrop for EM is quietly turning supportive as FX volatility compresses, with the inverted JPM EMFX vol index moving higher alongside a clear pickup in both the EM capital flow proxy and carry trade index. The relationship is consistent, when volatility falls, carry becomes more attractive and capital follows, reinforcing the flow cycle. What stands out now is that all three are moving in sync again, suggesting EM inflows are being driven less by directional macro bets and more by a revival of systematic carry.
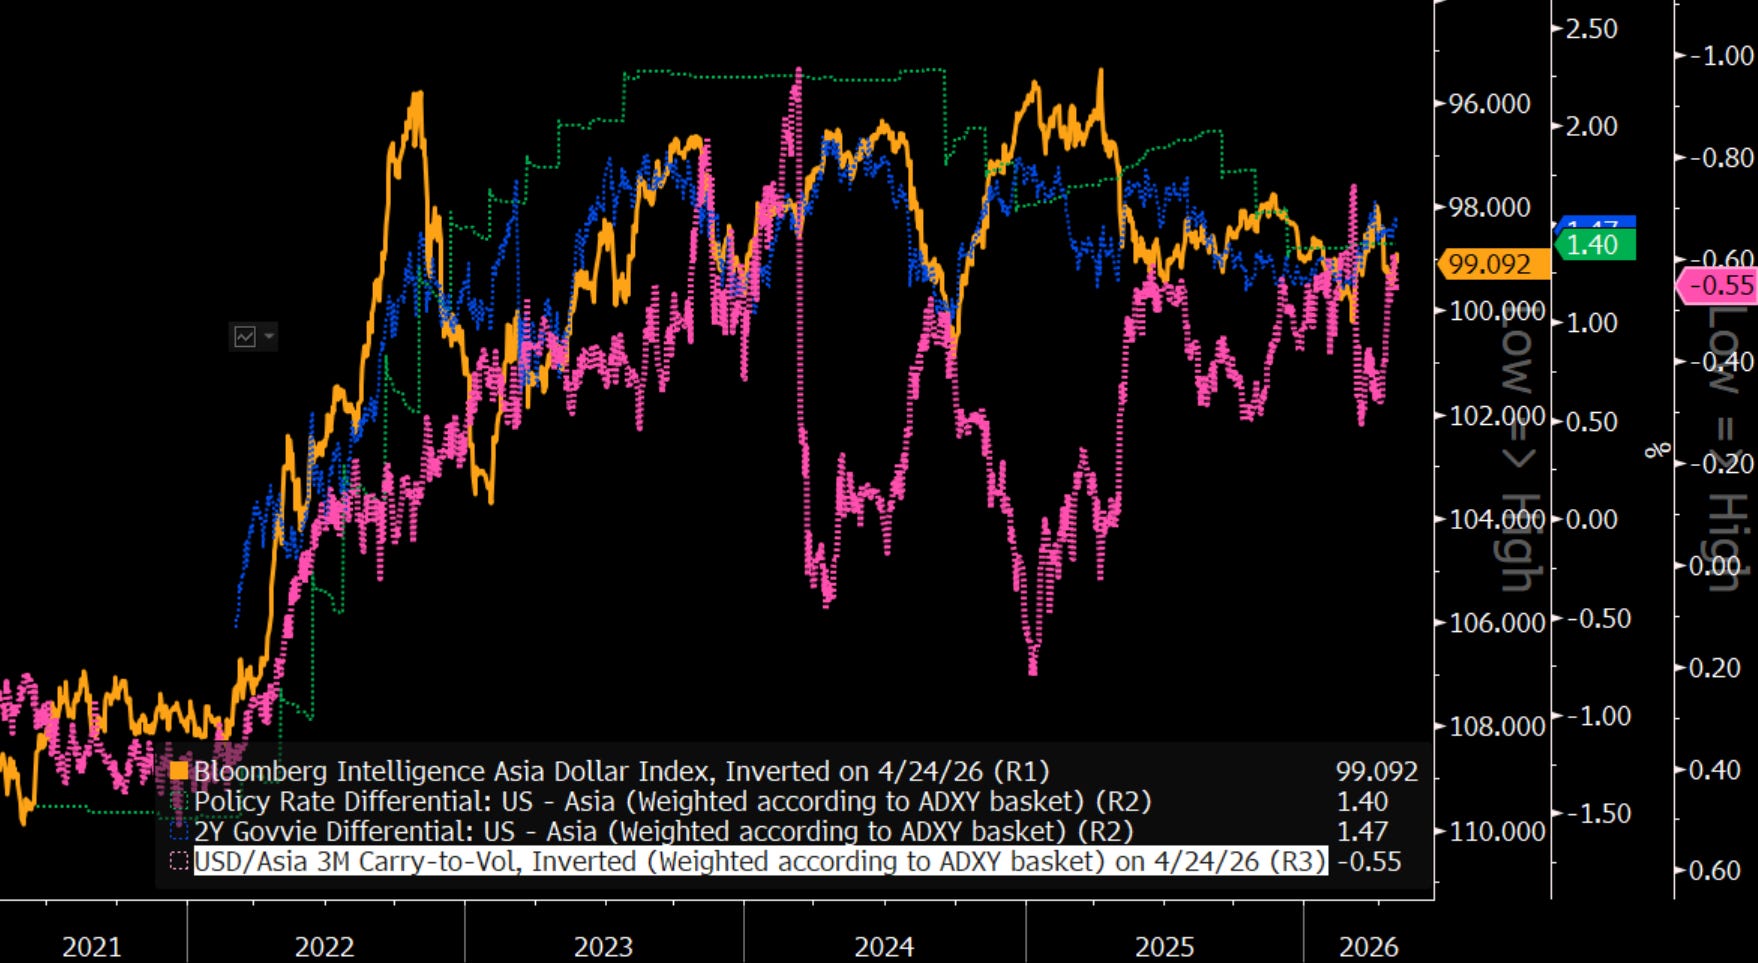
US–Asia rate differentials, across policy rates, front-end yields, and volatility-adjusted carry, are signaling a period of consolidation in dollar–Asia FX rather than a sustained move lower. Without a broader de-dollarization shift, capital outflows from Asia are unlikely to reverse meaningfully, limiting downside for the dollar. As seen in 2022–2024, large gaps between FX levels and rate differentials tend to close quickly when US rates remain elevated.
The UAE’s exit from OPEC adds uncertainty to oil markets, raising the risk of larger price swings and increased FX volatility across Asia, especially for oil-importing economies already under pressure since the Iran conflict began. With the Strait of Hormuz still a key constraint, these currencies may remain vulnerable in the near term. Longer term, the loss of a major producer from OPEC weakens its ability to manage supply, while the UAE’s shift toward higher output and pricing flexibility could put downward pressure on oil prices.
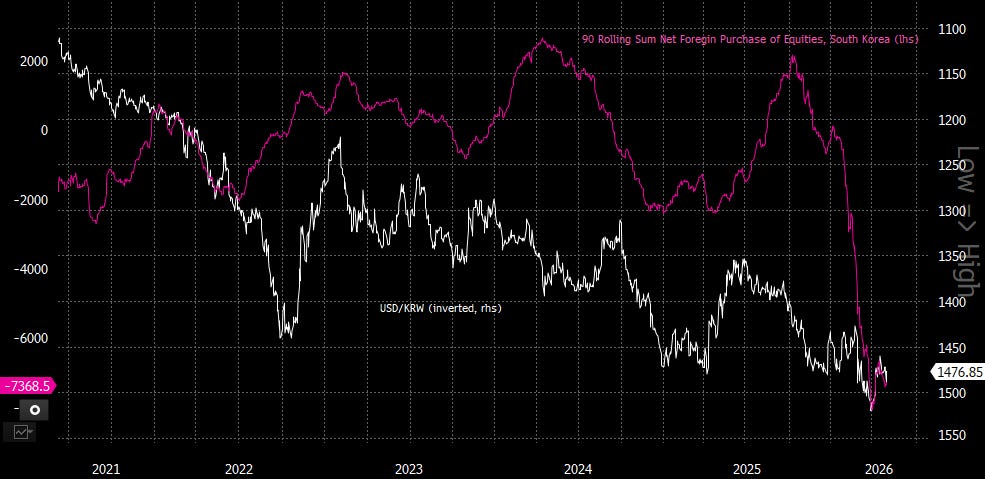
The Korean won’s slide to 1,500 per dollar, its weakest since 2009, puts FX stability at the top of the Bank of Korea’s agenda as leadership transitions approach. As a high-beta, oil-sensitive currency, the won has been hit hard by the Iran conflict and broader risk-off dynamics, with additional pressure from outbound investment flows. Even if geopolitical tensions ease, persistent capital outflows and policy uncertainty suggest the won may remain under pressure.
AUD/CAD is not a short it should be biased higher. In a full normalization scenario (low probability), de-escalation with a meaningful retracement in energy would favor dollar shorts versus importers. However, beyond a knee-jerk relief move, exporter relative value — such as AUD and NOK versus CAD — offers a more asymmetric trade. This reflects CAD’s sensitivity to oil, while AUD/NOK retain broader risk beta and can still perform under partial normalization. SEK may tactically lag due to dividend seasonality and Riksbank dynamics.
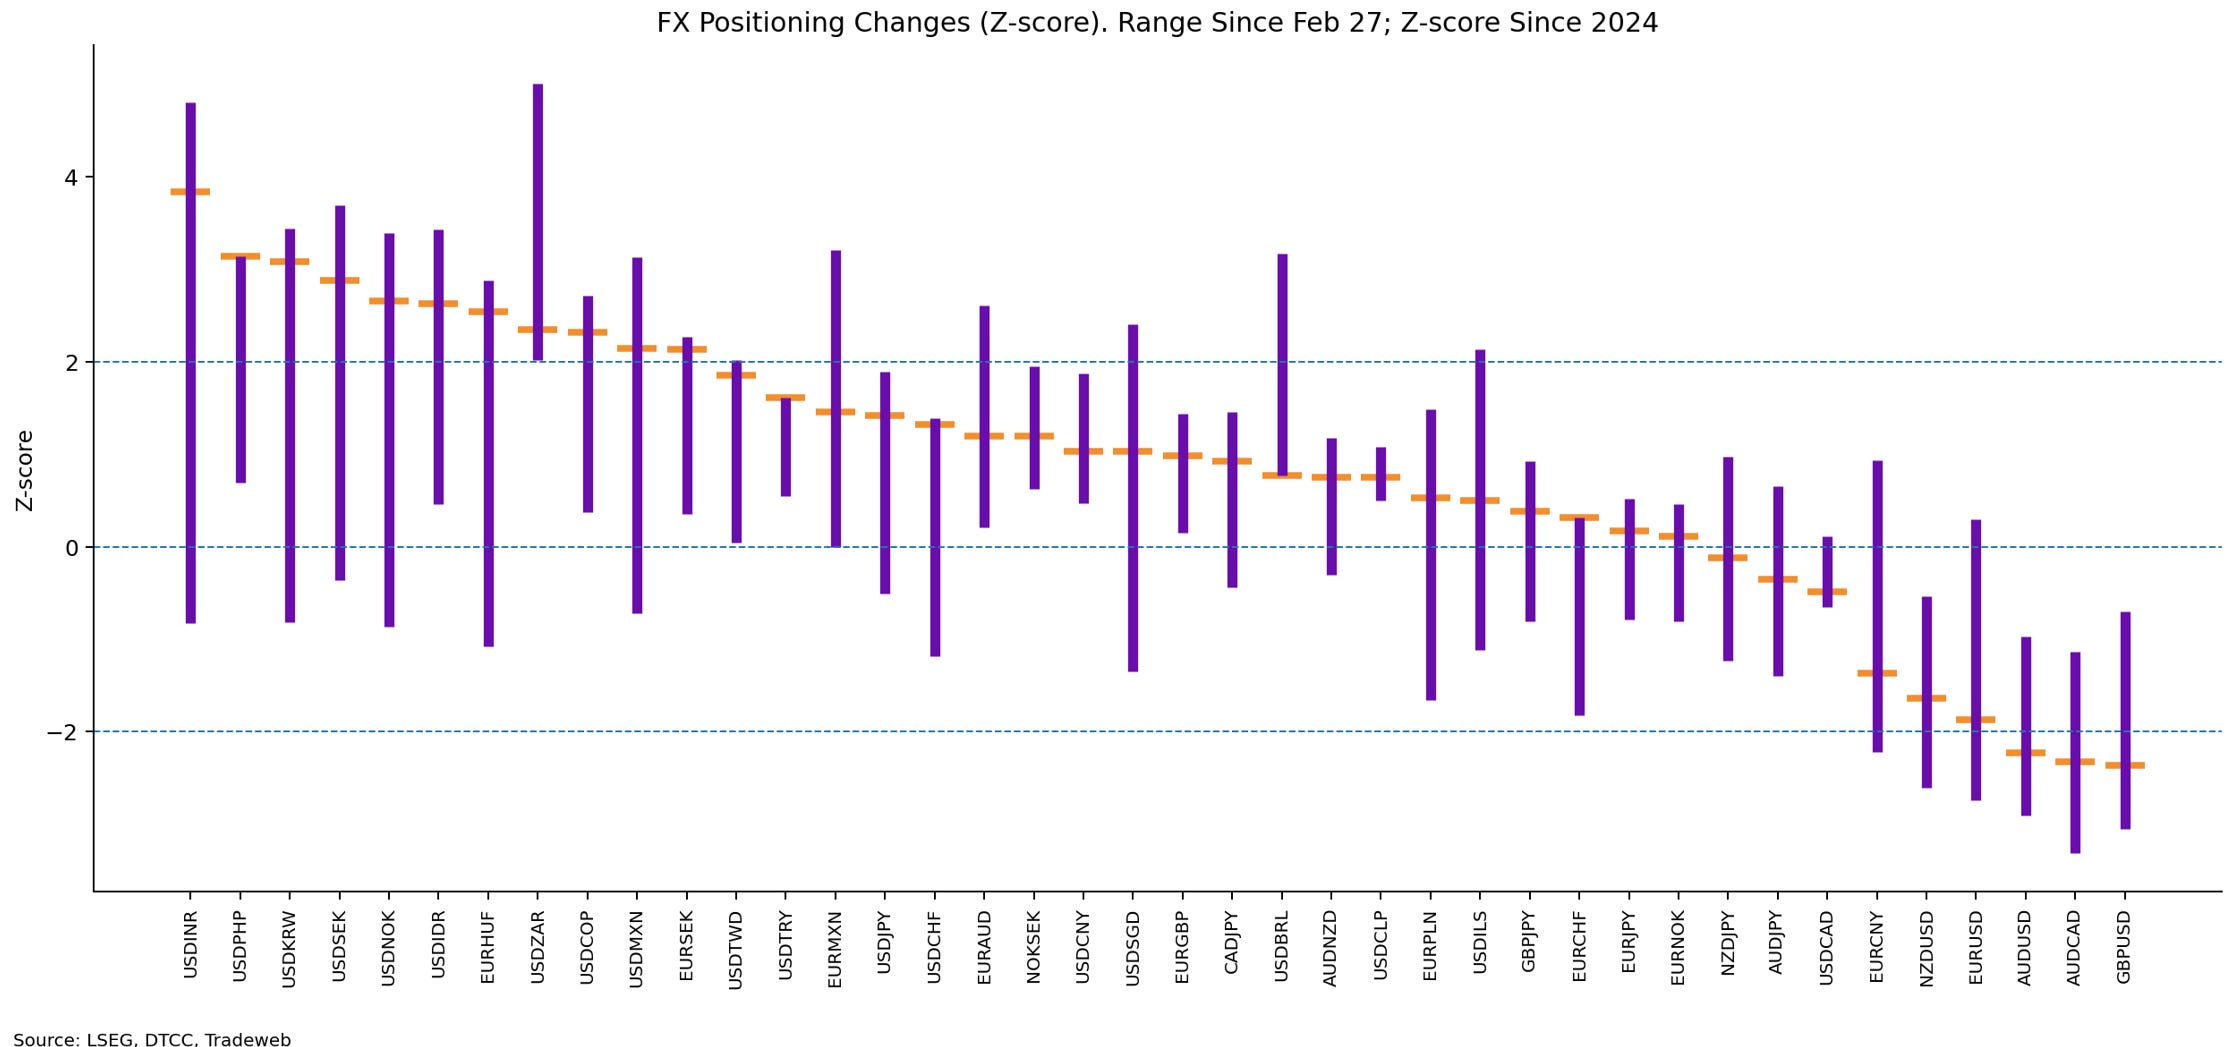
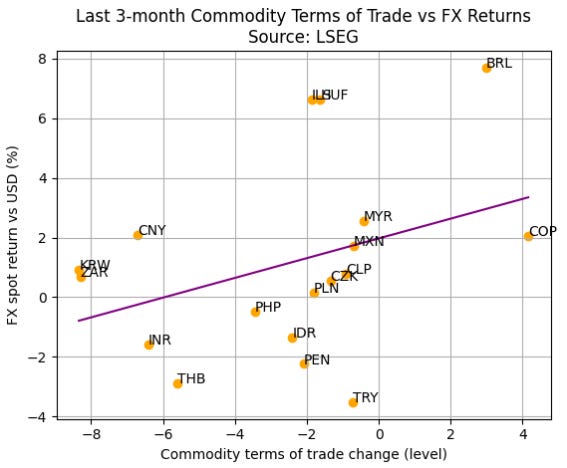
Commodities still matter for FX but it’s messy. Last 3M shows a positive but weak relationship between terms of trade and currency returns.
Big winners: BRL, ILS
Laggards: TRY, THB
Outliers everywhere
ToT helps directionally, but idiosyncratic + macro factors dominate in the short run.
Rates
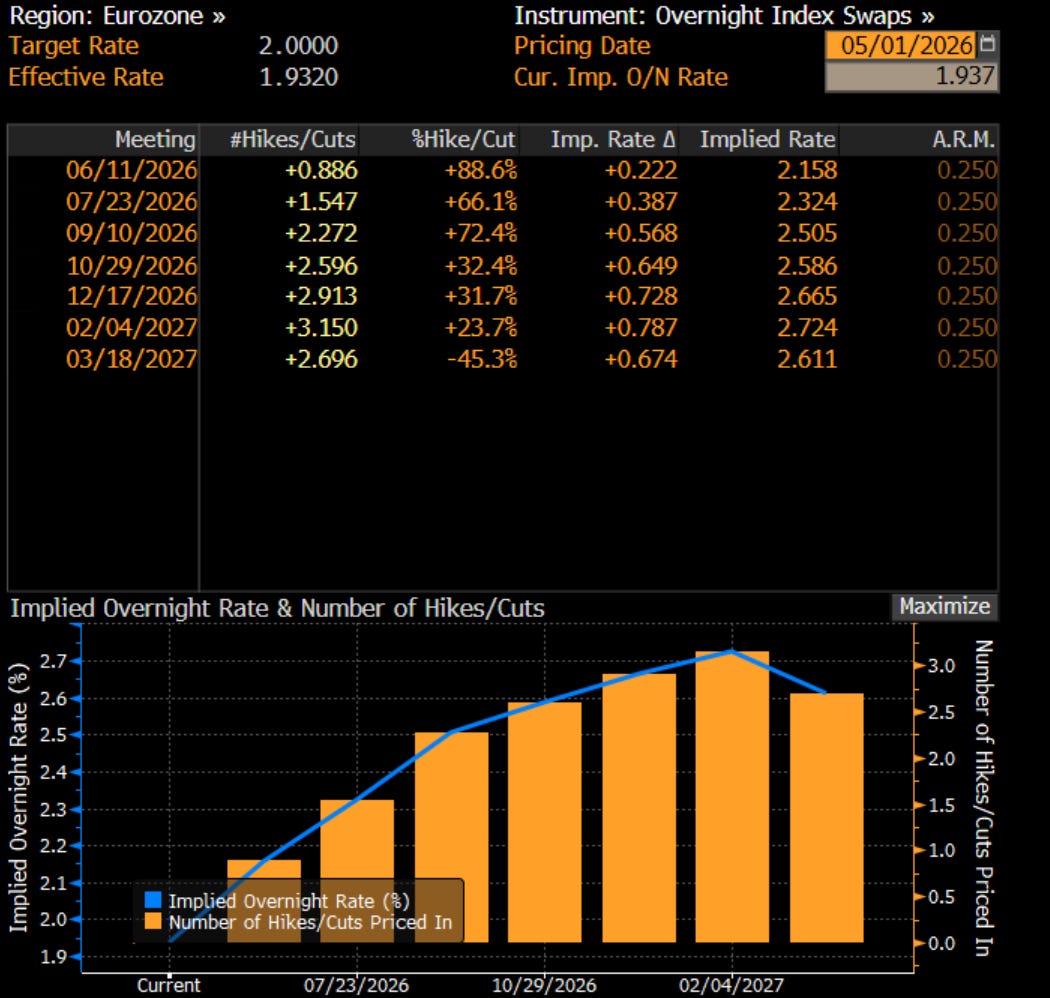
Geopolitical developments have had a much larger impact on the ECB. Markets are now pricing in roughly 75 bps of hikes (three hikes) from the ECB. This comes amid growing concerns that inflation could become more entrenched in Europe due to disruptions caused by the closure of the Strait of Hormuz.
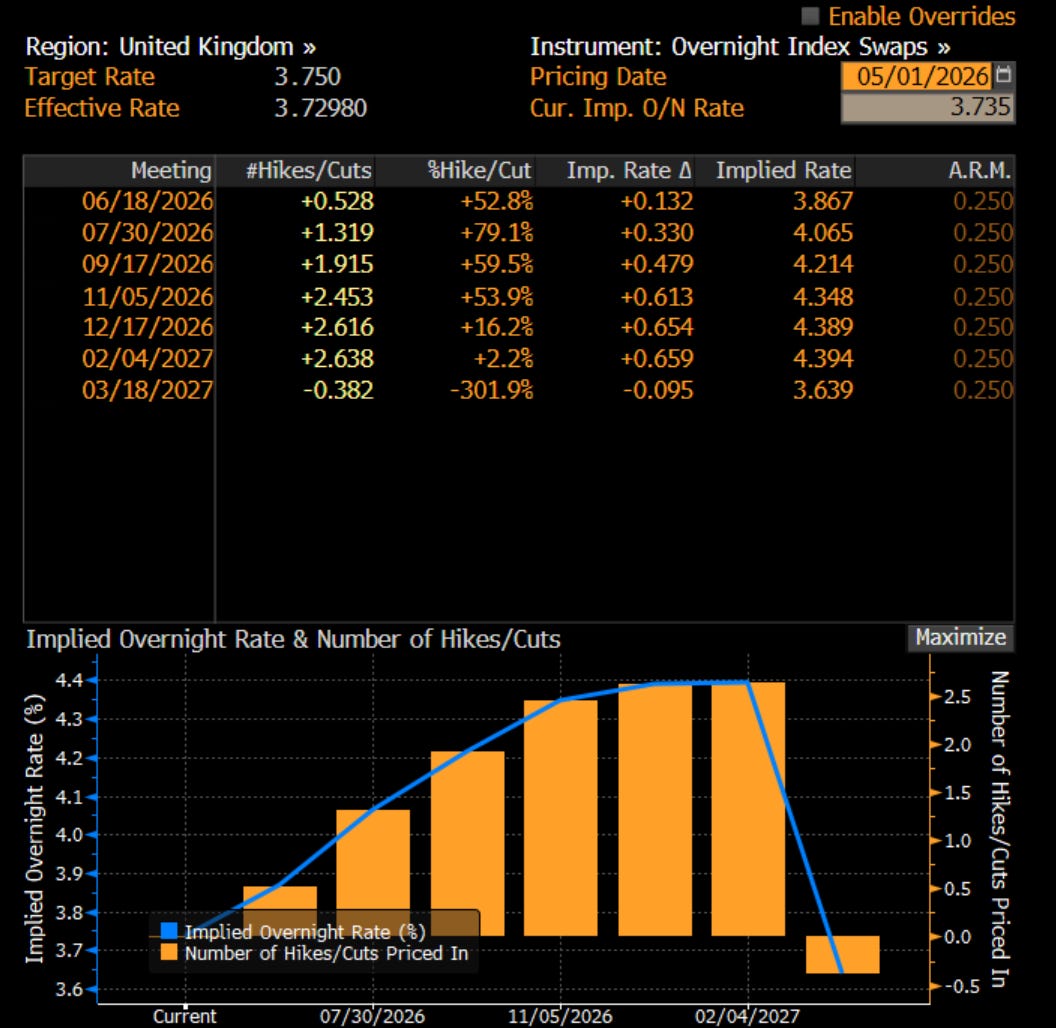
A similar dynamic is evident in market-implied pricing for the Bank of England. Markets are currently pricing in around 50 bps of tightening. The Bank of England is facing comparable challenges, including persistently sticky consumer prices and expectations that geopolitical developments could exacerbate inflationary pressures, alongside ongoing fiscal concerns in United Kingdom.
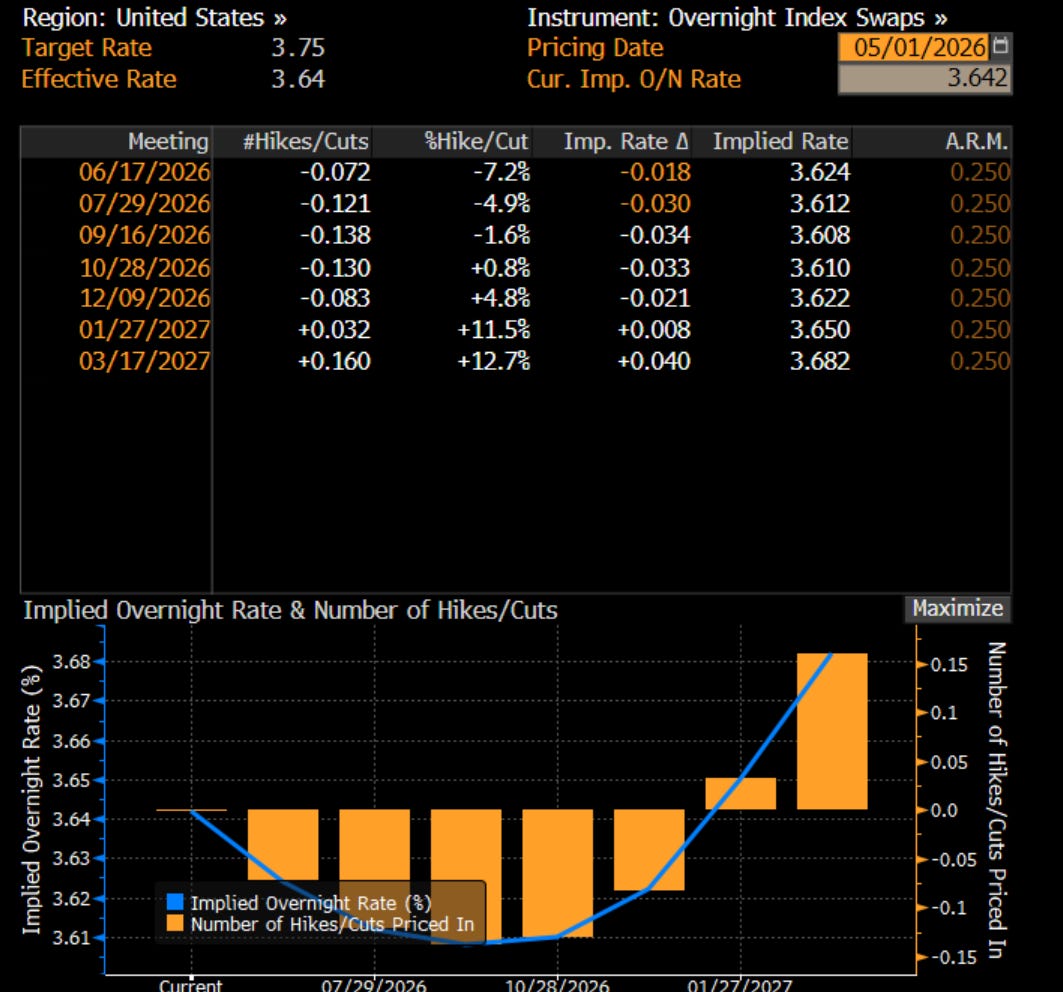
Finally, in the United States, the policy rate is expected to remain relatively unchanged over the next year. Stagflation risks are considerably lower, supported in part by the strength of the U.S. dollar, which helps mitigate import-driven inflation. Additionally, the country’s reduced reliance on oil and gas imports provides a further buffer against external energy shocks, enhancing its relative insulation.
The repricing at the short end of the curve, where yields are rising faster than at the long end, has led to a flattening of the 2s10s curve. I expect the short end to move toward 4%, while the 10-year yield rises more gradually, driven by higher embedded inflation expectations and an increasing term premium
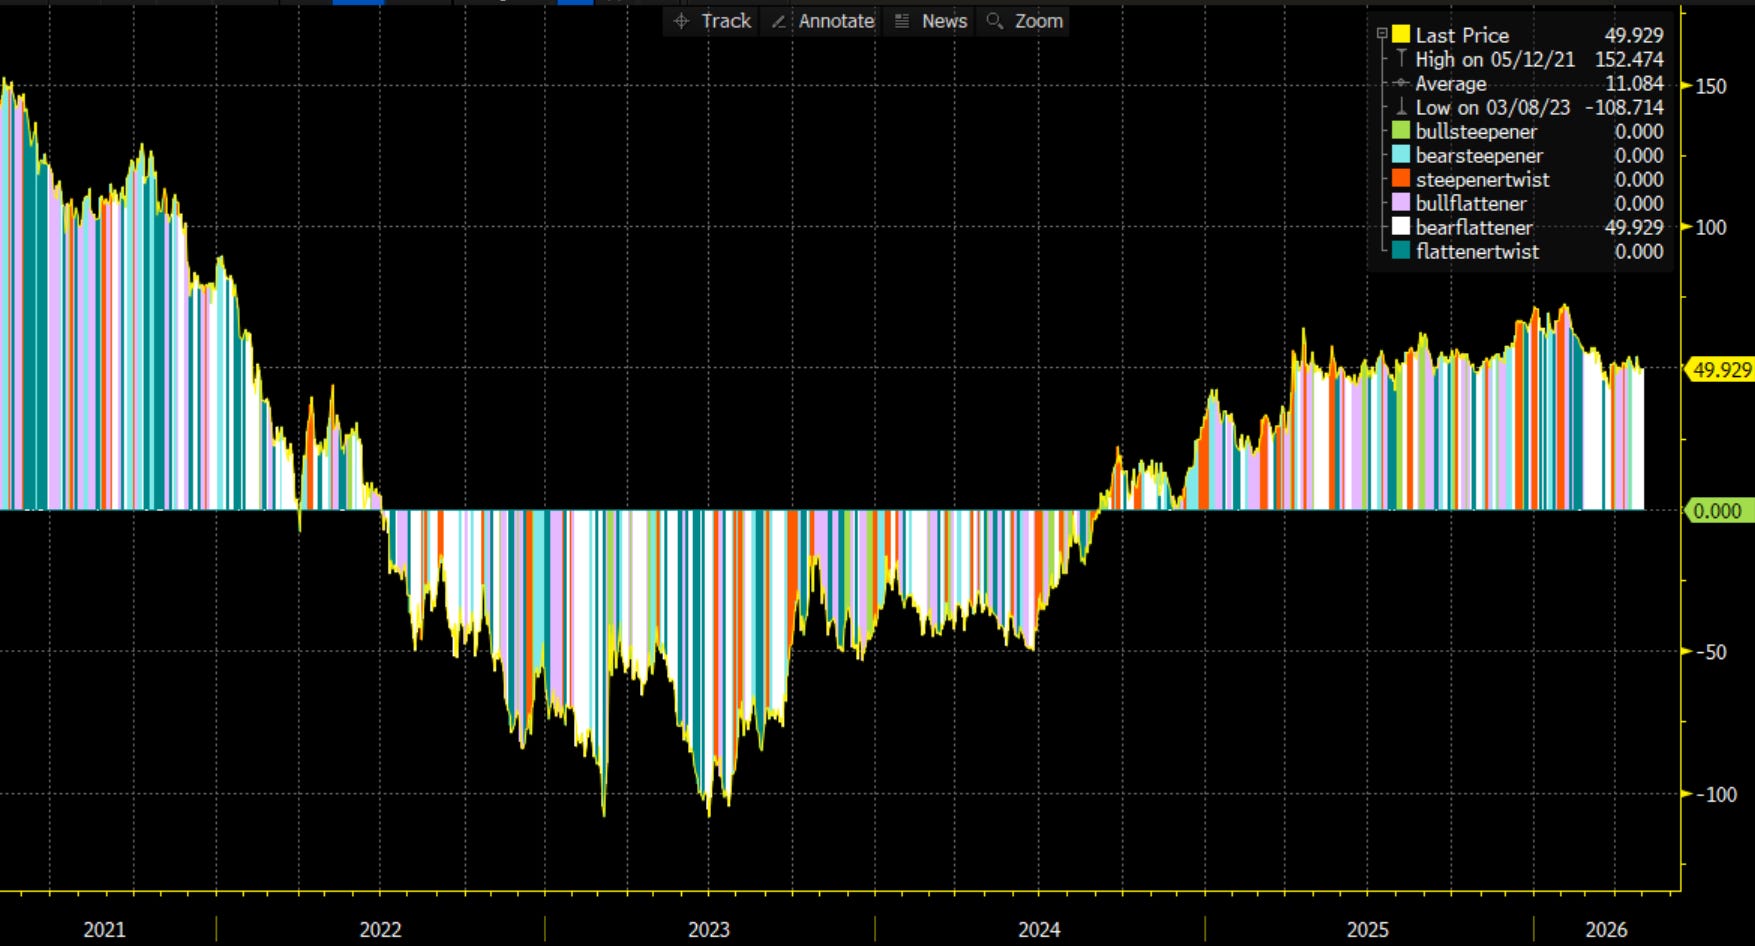
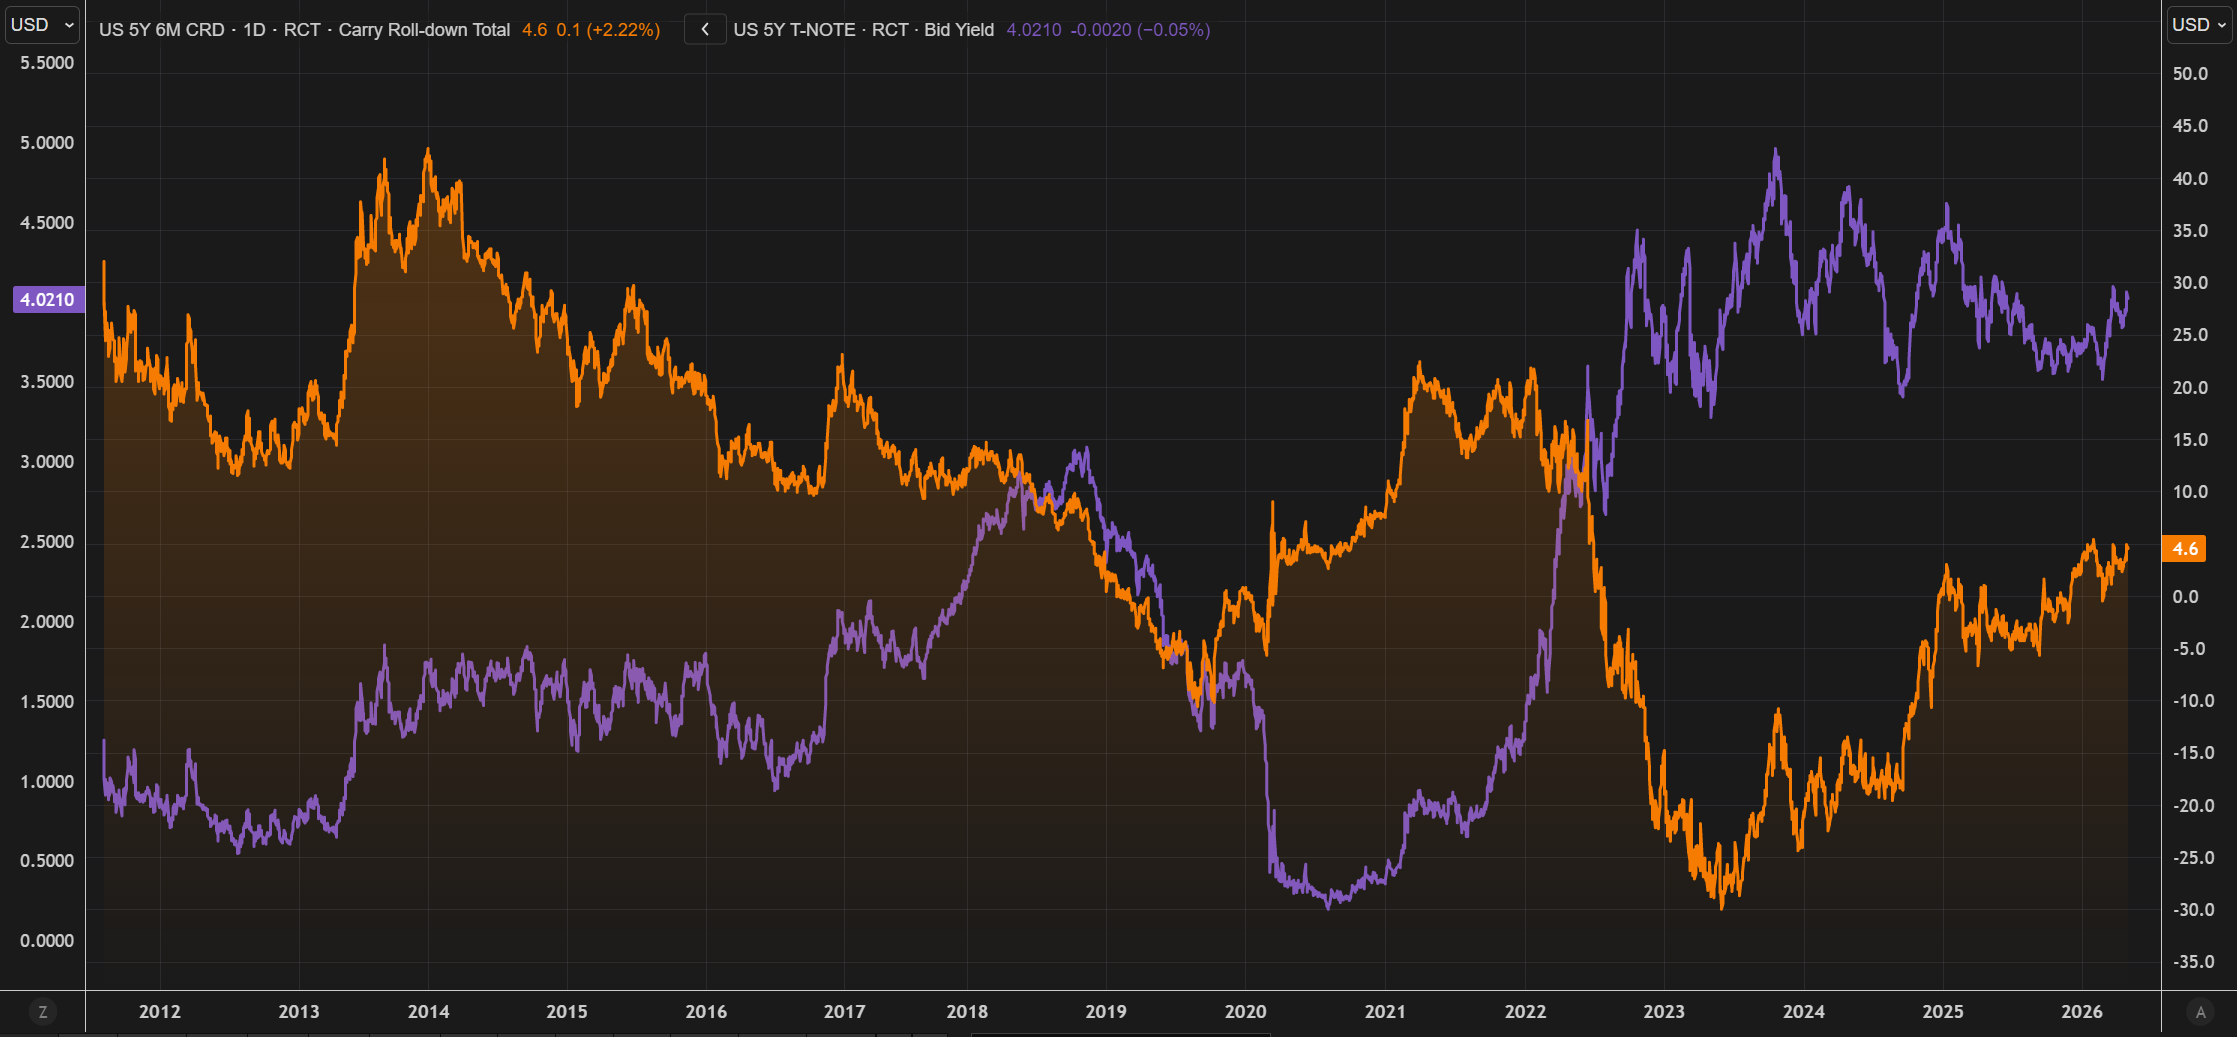
Right now, the opportunity set is compelling—investors are being paid to own duration through both carry and roll. United States Treasuries at the 5-year point have not offered this combination of yield, carry, and roll-down in a long time, making the belly of the curve particularly attractive from a total return perspective.
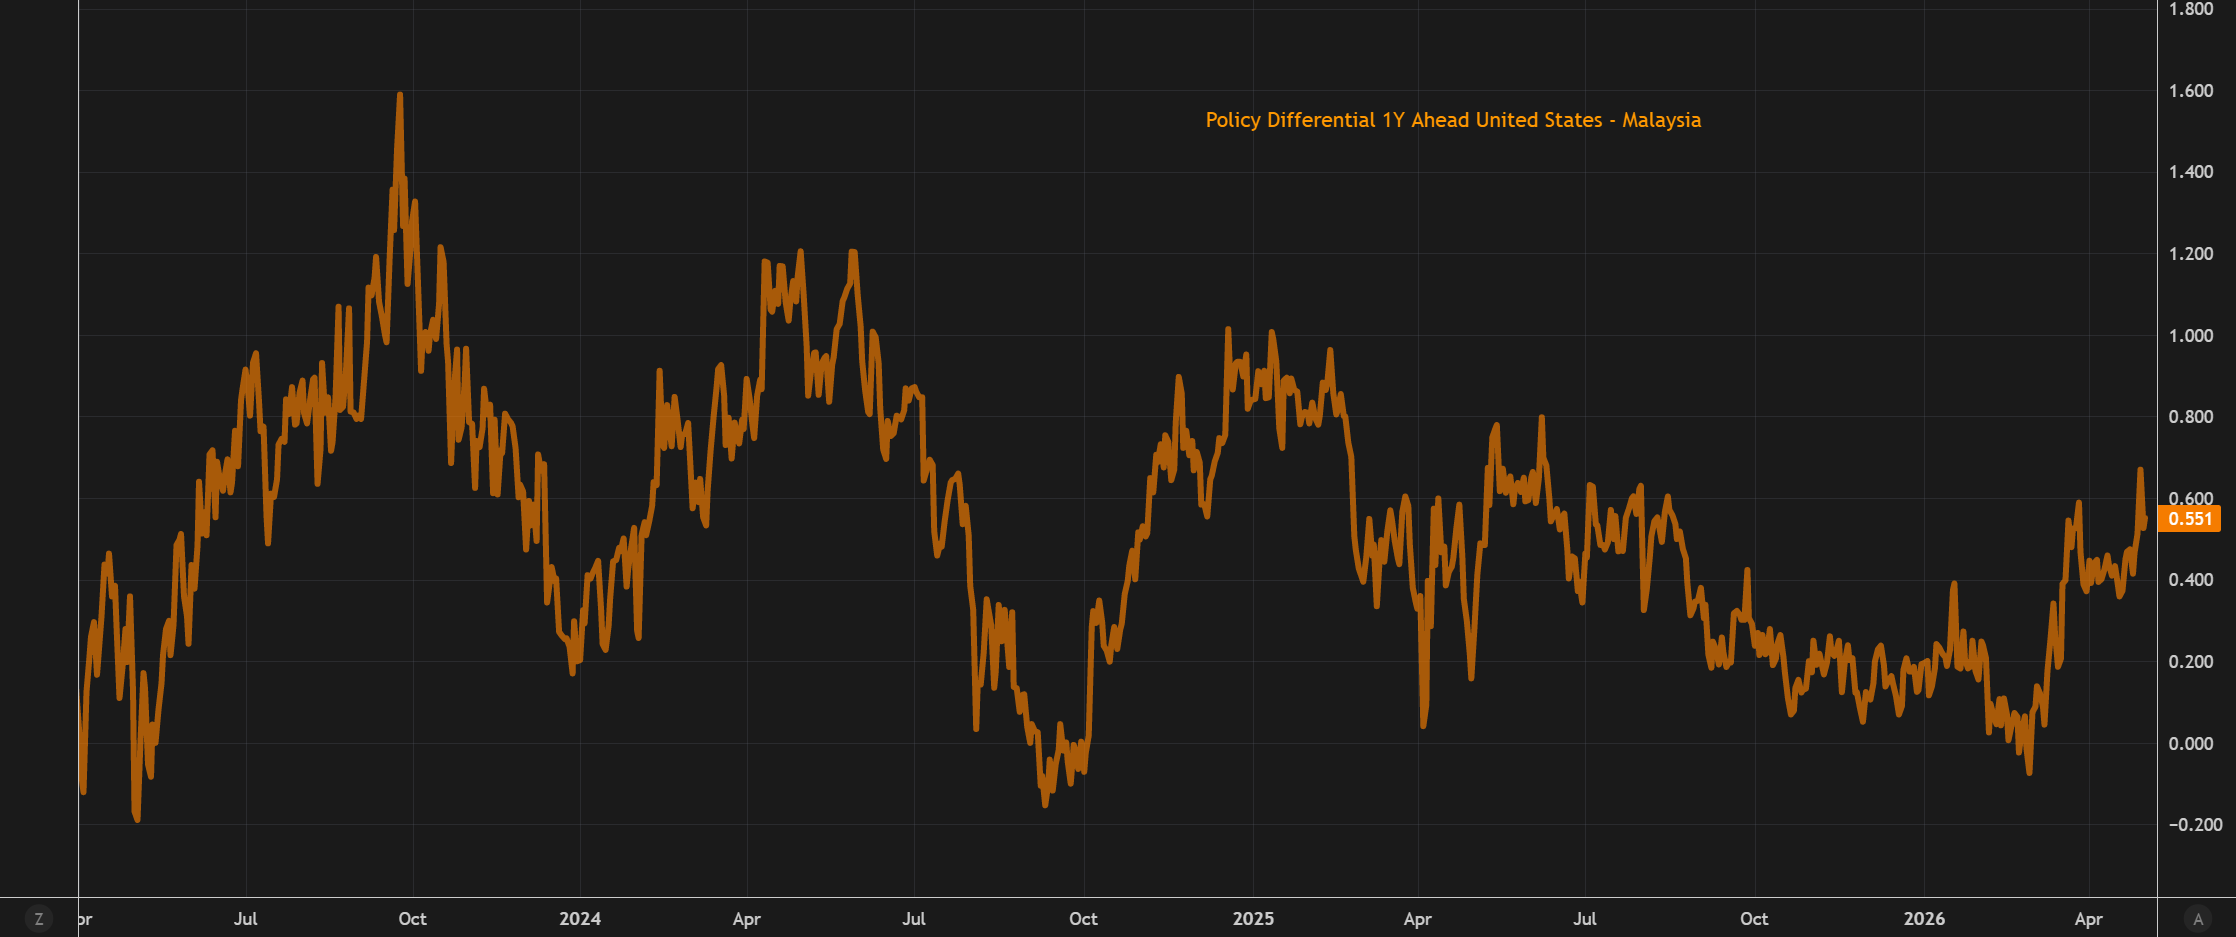
A key dynamic is the divergence in the forward policy path between the Federal Reserve and Bank Negara Malaysia. While the Fed is expected to keep policy relatively tight over the next year, the implied easing path from BNM is more gradual, resulting in a widening or at least sustained policy rate differential in favor of Malaysia on a forward-looking basis.
This relative stability in Malaysia’s policy trajectory versus a still-restrictive Fed supports yield differentials that are conducive to currency strength, as markets price a more anchored rate path in Malaysia compared to the U.S.
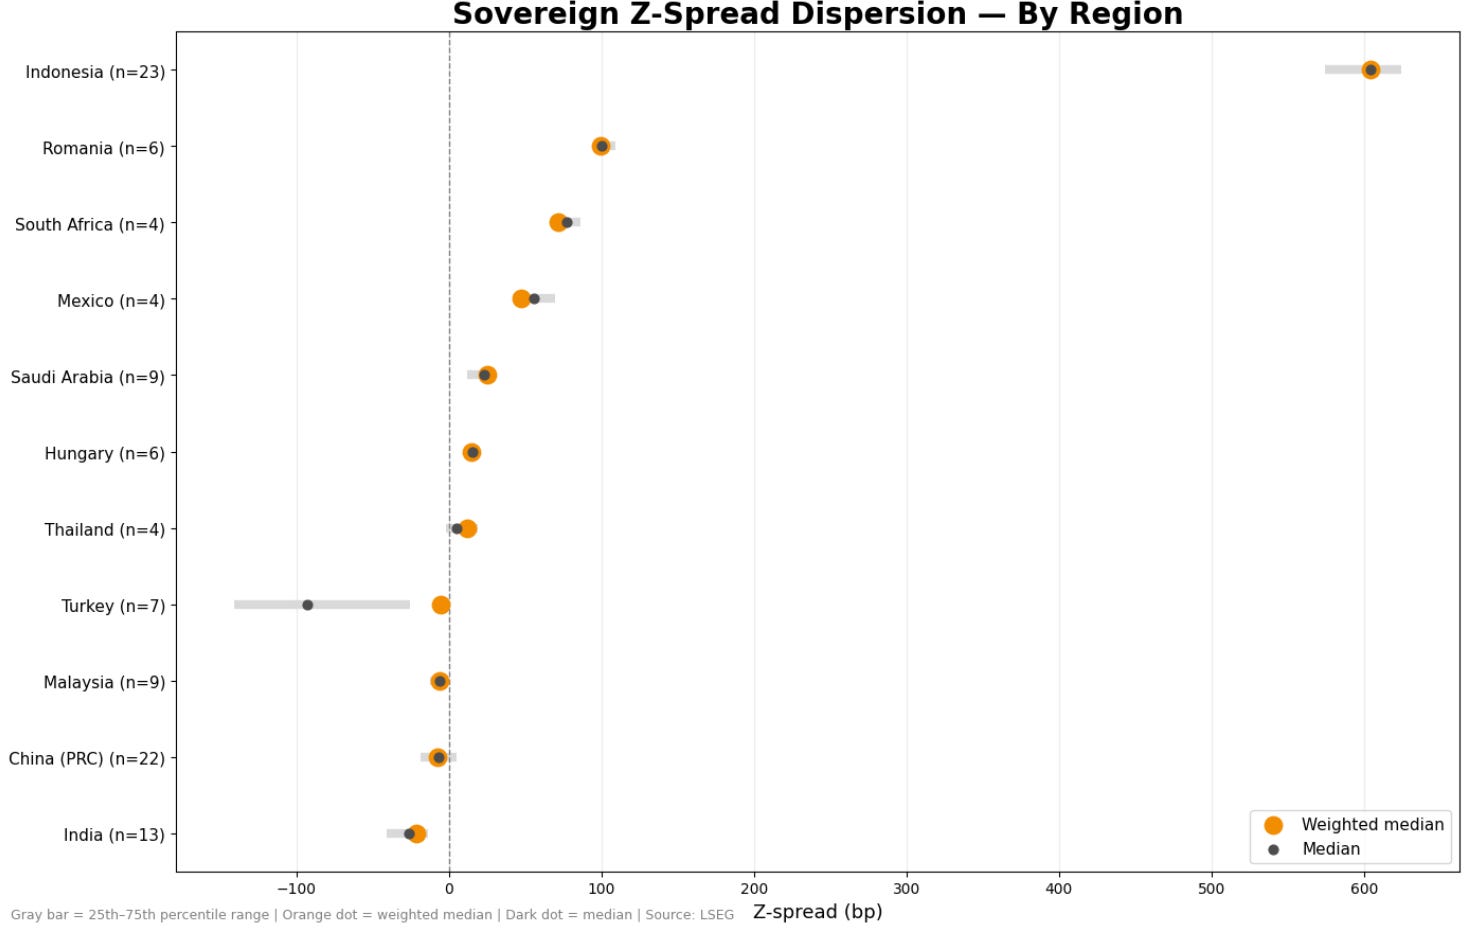
EM sovereign spreads are no longer trading as a single beta dispersion is doing the work. The edge is in relative value long policy-credible, low-dispersion Asia versus high-beta, wide-dispersion sovereigns exposed to global rate volatility
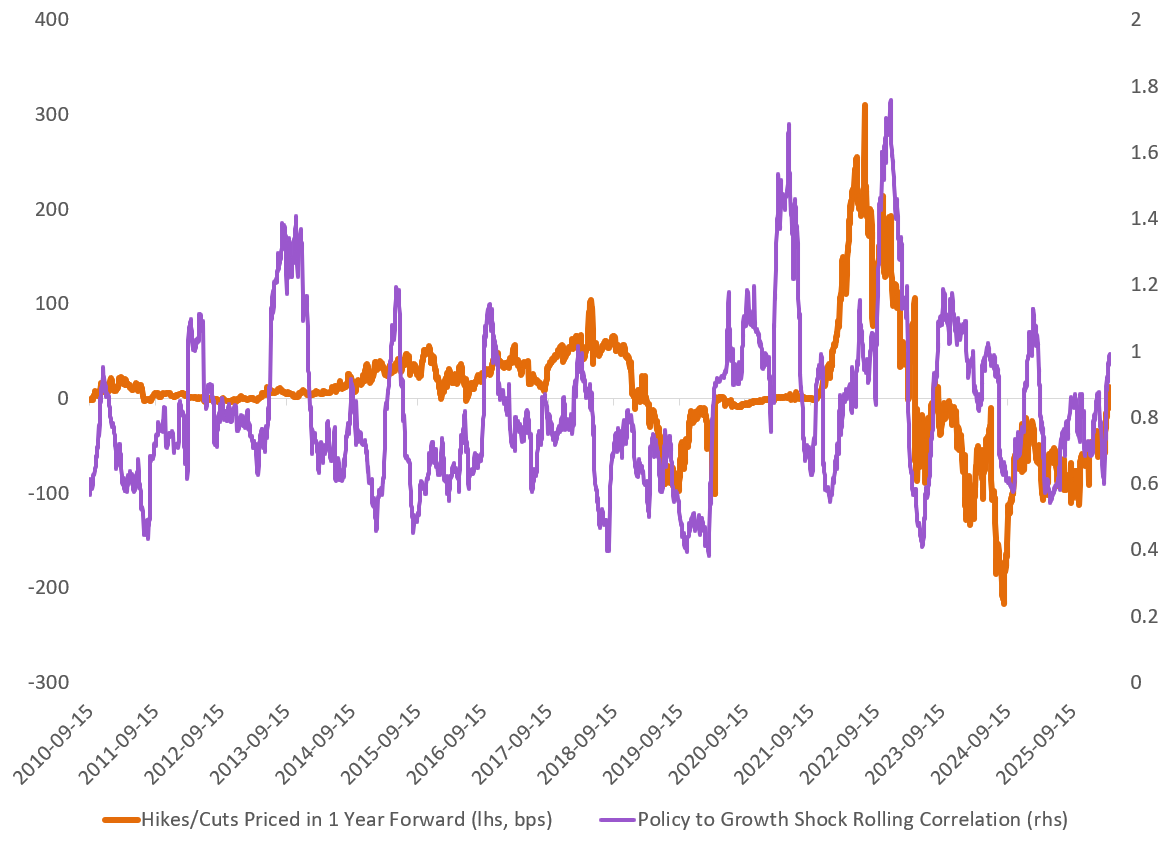
The breakdown in the relationship between monetary and growth shocks signals a shift from a macro-driven rates regime to a policy-dominated one. In this environment, front-end pricing is less about realized data and more about uncertainty around the central bank reaction function raising volatility and reducing the reliability of forward guidance embedded in the curve.
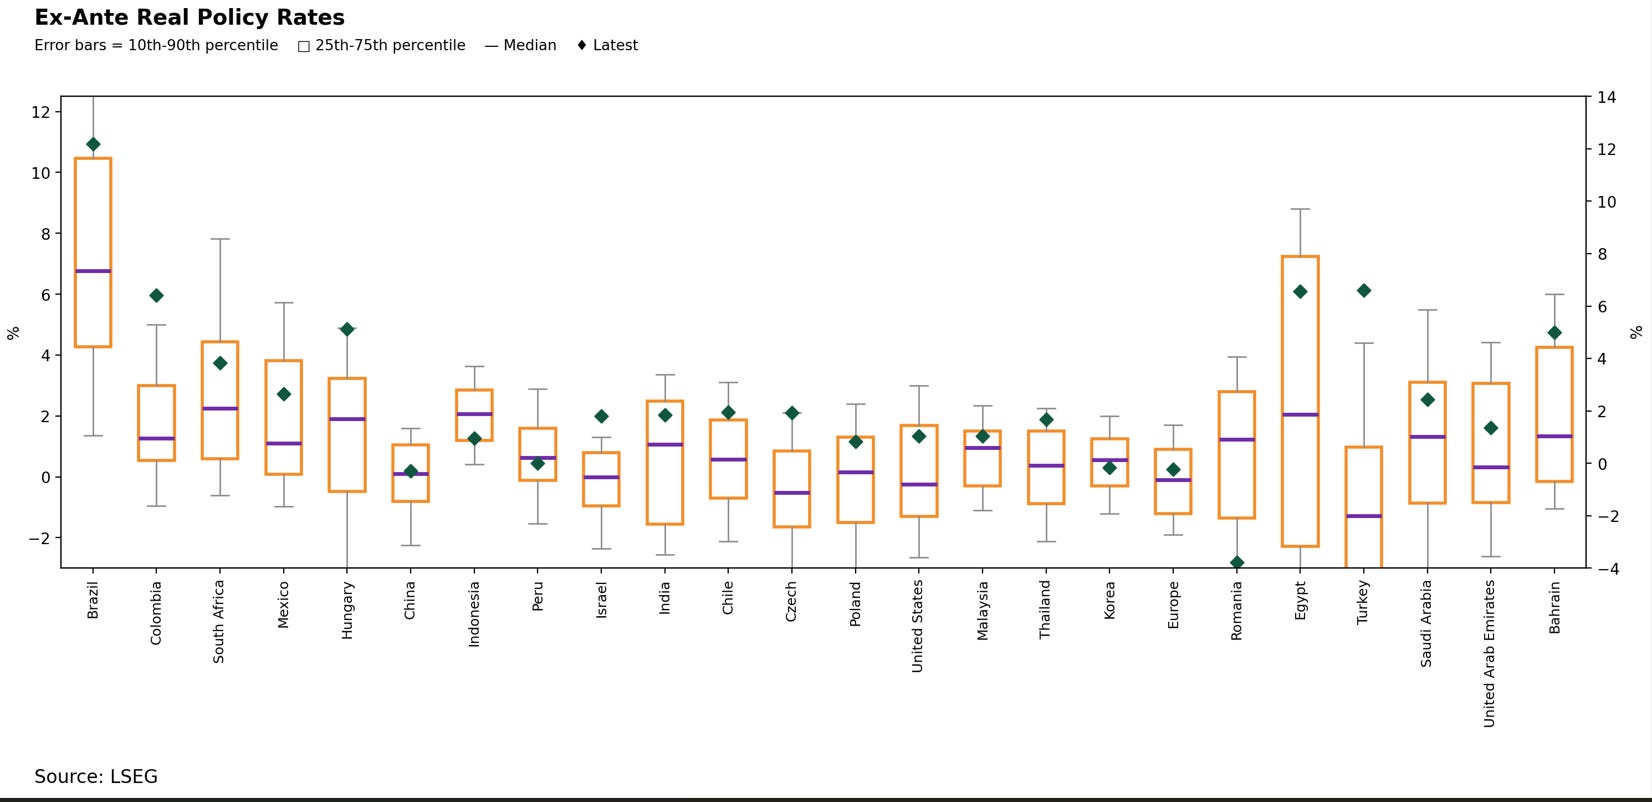
Real policy rates provide a useful lens for assessing which economies have room to respond to a slowdown. Across emerging markets, real rates remain meaningfully positive in several key economies—including Brazil, Colombia, South Africa, Hungary, Indonesia, India, and Chile—indicating substantial policy space to ease if growth weakens.
This contrasts with many developed markets, where real rates are closer to neutral and policy flexibility is more constrained. In practical terms, higher real rates in these emerging economies act as a buffer: central banks can cut rates without immediately jeopardizing currency stability or reigniting inflation.
From a macro perspective, this implies that emerging markets are currently better positioned to absorb negative growth shocks. Rather than being forced into procyclical tightening, policymakers in these economies retain the ability to respond countercyclically supporting domestic demand, easing financial conditions, and smoothing the impact of external shocks.
The broader implication is a shift in the traditional narrative. While emerging markets have historically been more vulnerable during global downturns, the current backdrop of elevated real rates suggests a greater degree of resilience, with policy space now acting as a stabilizing force rather than a constraint.
Energy shocks don’t just move markets. they reshape industries
Every spike in oil prices does something deeper than inflation headlines:
It accelerates the shift already underway:
EV adoption speeds up
Governments double down on renewables
Countries rethink energy dependence
Europe isn’t “suddenly going EV”. it’s speeding up a transition already in motion
Geopolitics isn’t changing the direction of energy…
It’s changing the speed of it.
energy security is becoming the new economic strategy.
Amazing insights in this macro report!