

Credit Impulse and Global Outlook

Introduction
There continues to be a great deal of uncertainty in the world, and that theme does not appear likely to ease anytime soon. The question going forward is: where is the world headed, and what indicators can we use to separate the noise from the constant bombardment of news? It is essential to focus on empirical data that can help guide us through uncertain times. In particular, we should consider where we are in the credit cycle and the current state of the manufacturing cycle. These cycles have significant effects on asset markets as well as the overall demand for commodities.
Credit Impulse Theoretical Framework
Let’s start with the mathematical framework:
GDP in a given year:
GDP_t = C_t + I_t
Where:
C=Consumption
I=Investment
Change in GDP first difference:
ΔGDP_t = ΔC_t + ΔI_t
Now, assuming investment is financed by borrowing. If debt at the start of a period is D_t, and investment is fully debt-finacned:
I_t = ΔD_t
i.e., investment equals the flow of new credit.
The change in the flow of credit becomes:
ΔI_t = Δ²D_t
i.e., the change in investment equals the second derivative of debt - how fast the flow of credit is accelerating or decelerating
Plugging back into GDP:
ΔGDP_t = ΔC_t + Δ²D_t
The second derivative of credit - Δ²D_t - is known as the credit impulse, and it captures the acceleration or deceleration of new lending. It also tells us that GDP growth depends on the credit impulse, not the growth of credit. Thus it is a leading indicator of change in economic growth.
In more simplistic terms, the argument starts with a classic Keynesian idea: equilibrium GDP is tied to a stable level of investment. Without a change in investment, there is no growth. But when investment increases—especially if it’s financed through new borrowing—it triggers a new, higher level of economic activity.
Critically, it’s not just about having a lot of loans (the stock of credit), nor just about the amount of new loans (the flow), but about the change in the flow of loans. If the flow of credit is rising, we get accelerating investment and faster GDP growth. If the flow is flat or falling, growth slows or contracts.
This concept leads to a key insight: economic expansions are closely tied to rising credit impulse, while slowdowns often follow a deceleration or contraction in the credit impulse.
Credit Impulse
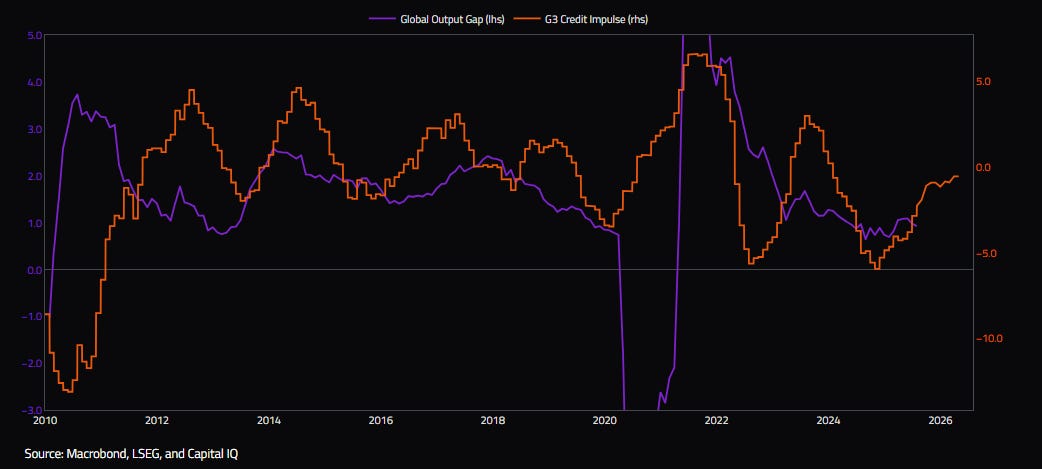
Following a sharp contraction, we have begun to see a strengthening credit impulse. This renewed strength will help lay the foundation for increased commodity demand and support the broader global business cycle going forward.
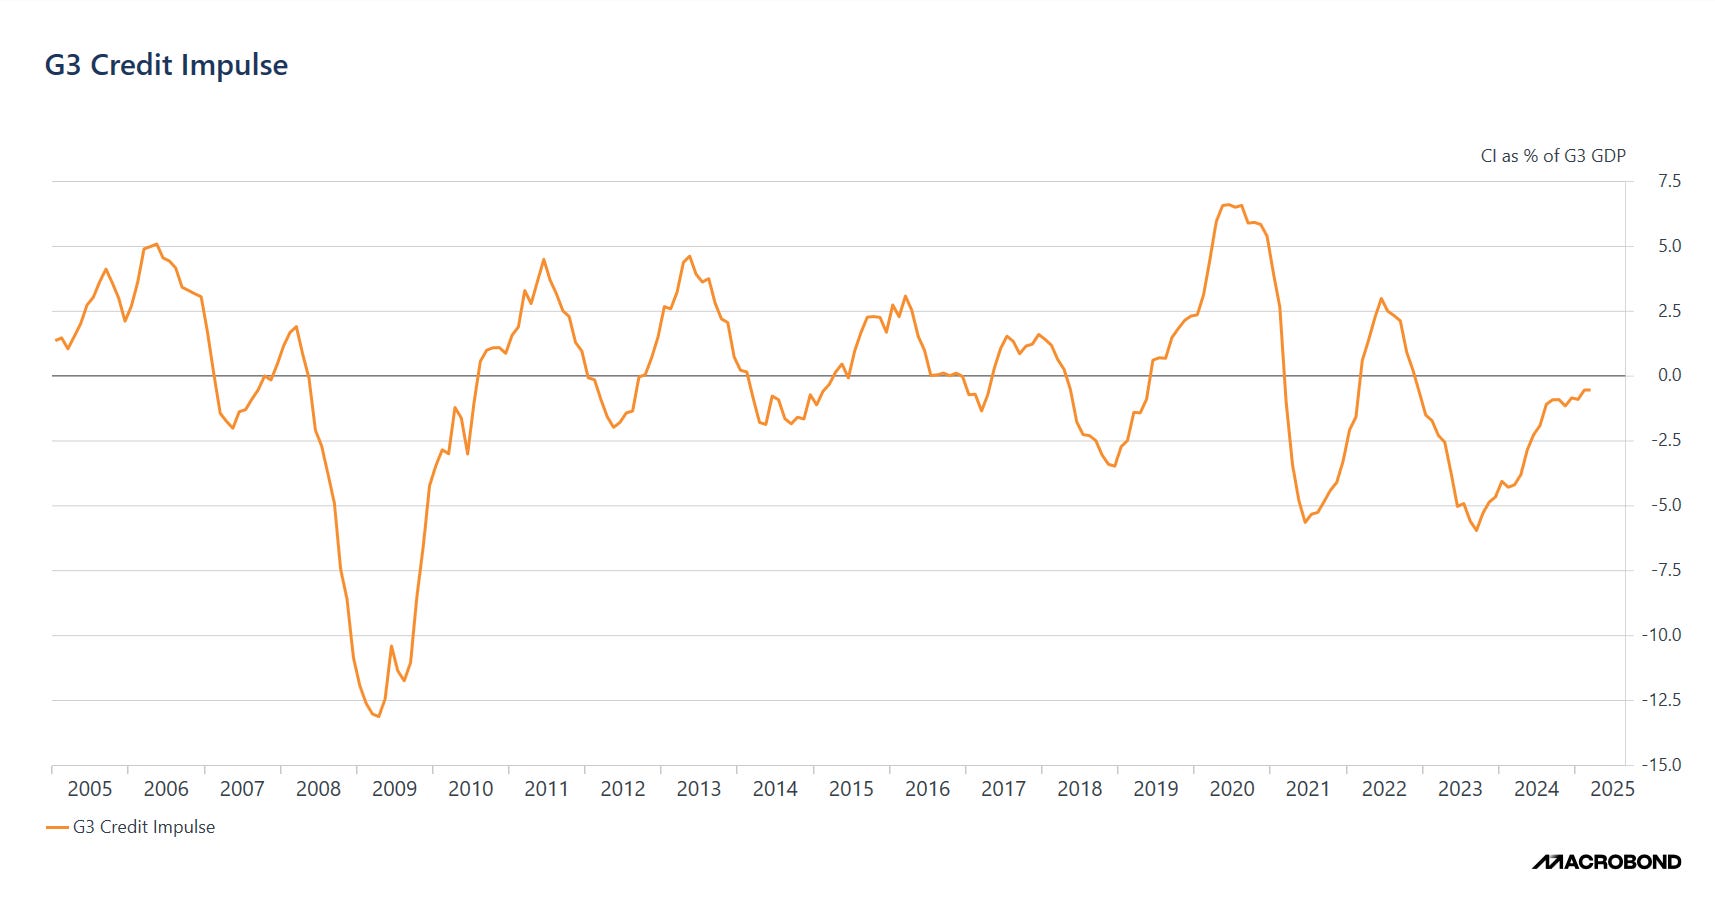
The credit impulse has historically been a reliable leading indicator for global manufacturing. As the math above illustrates, the cyclical elements of the economy are driven not by the growth of credit itself, but by the credit impulse—the change in the flow of new credit.

The credit impulse within the G3 economies—including the United States, China, and the European Union—should be closely watched as a barometer of investment and consumption, which in turn drives higher demand for metals and other commodities. A strengthening credit impulse signals continued growth and investment, suggesting we should expect a rise in demand for metals heading into 2026.
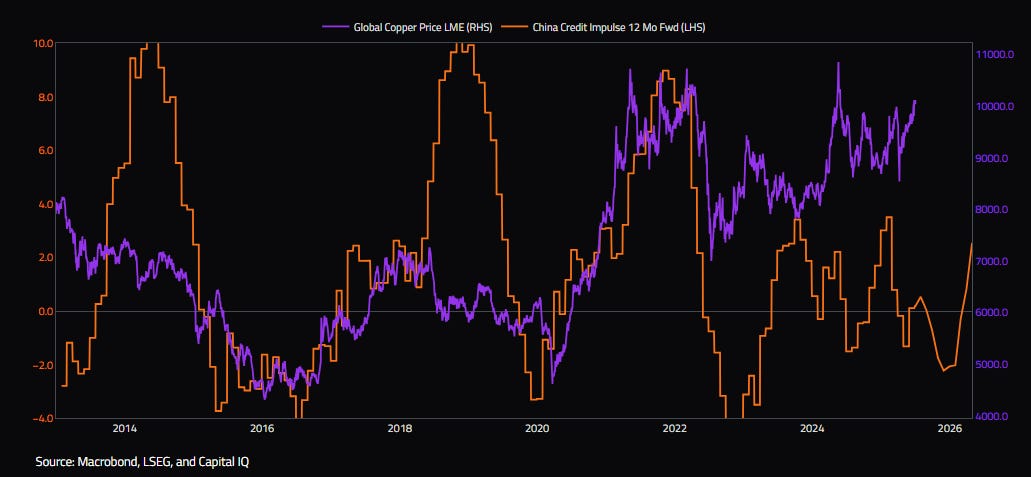
Within this dynamic, China accounts for approximately 50–60% of global metal demand, making its credit impulse a major driver of boom-bust cycles in commodity markets. As one of the largest consumers of virtually every major commodity, China has an outsized impact on global pricing.
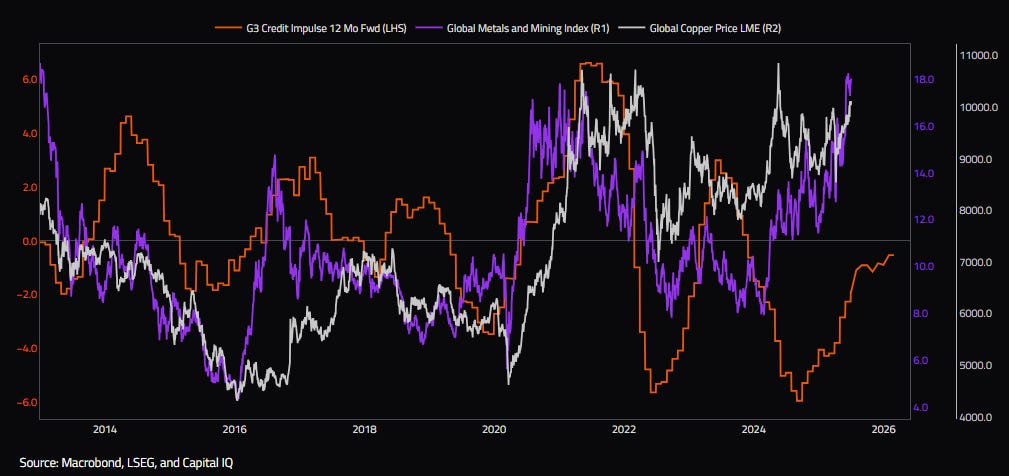
Lately, China has experienced weak demand, leading to a decline in copper shipments to the country. This shortfall was largely offset by increased demand from the United States. However, looking at China alone, the forecast suggests a rapid increase in credit flows. Historically, this has led to significant upward moves in copper prices. Beyond this, several other factors point to rising Chinese demand for copper—namely, the energy transition, growing domestic EV demand, and a potential revival in global demand for Chinese manufacturing.
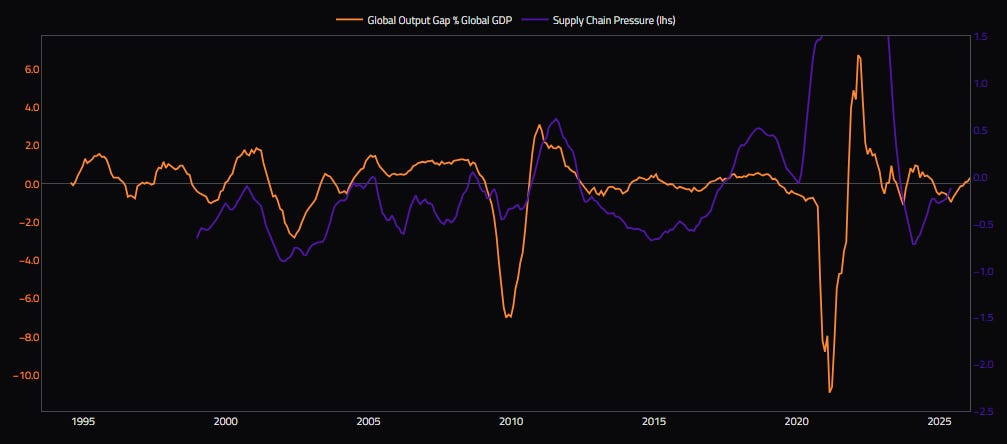
World trade volumes are rising year-over-year, and given the continued increase in the credit impulse, global trade is expected to maintain a solid growth rate. This expansion will be supported by ongoing improvements in the global output gap.
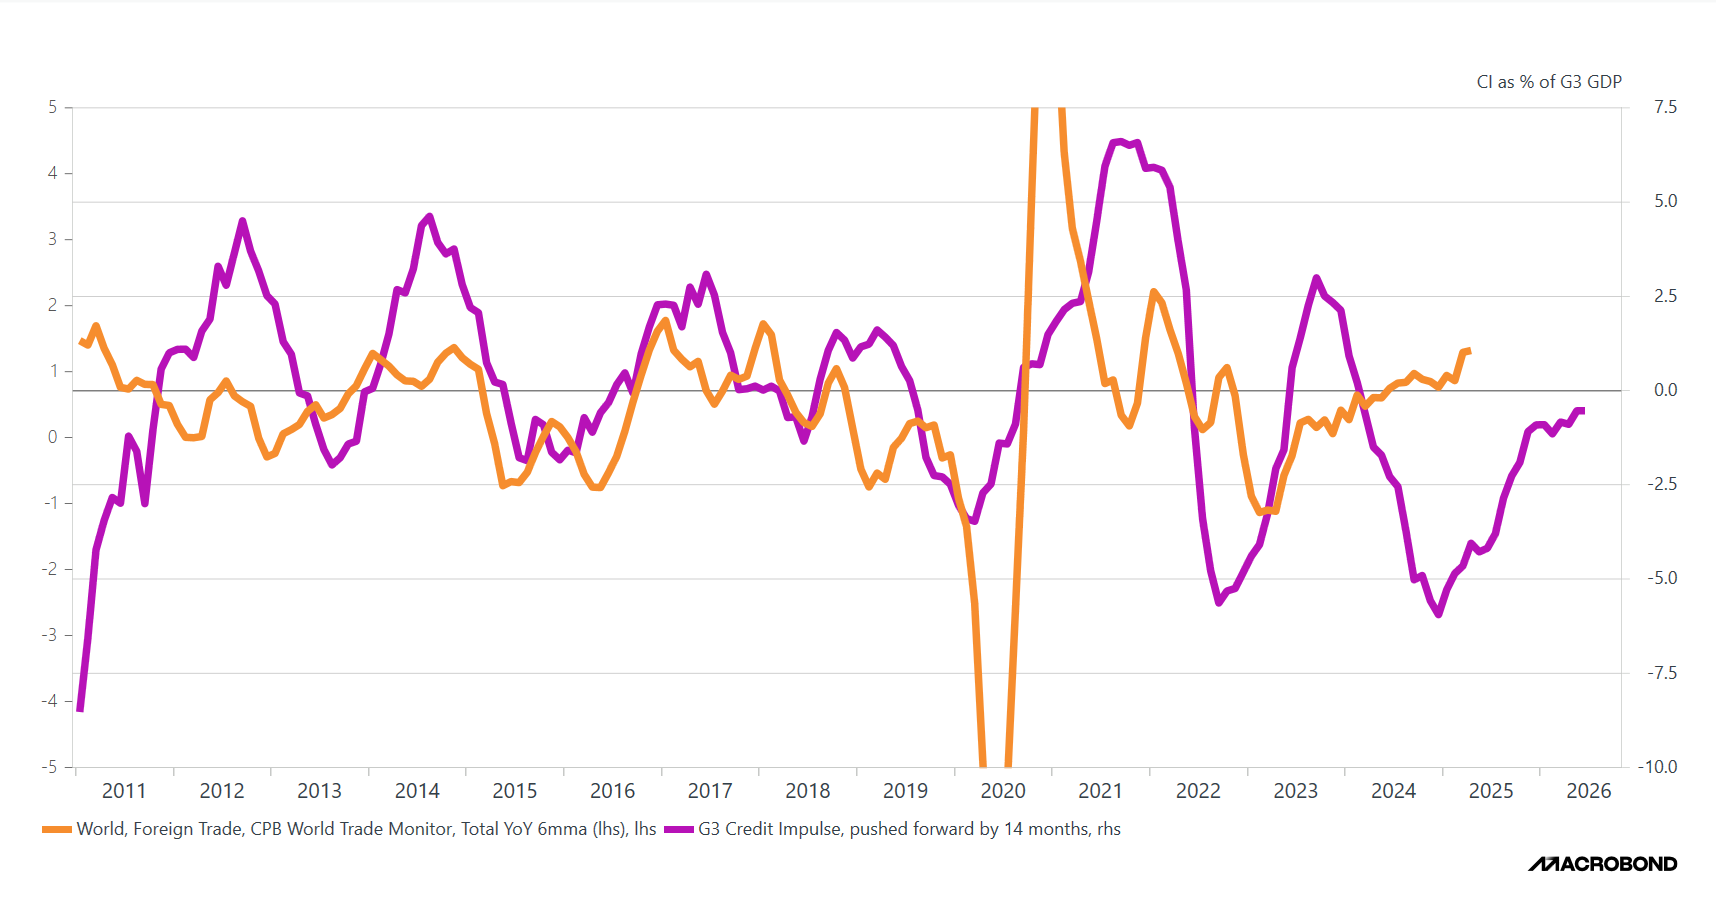
Now, if GDP (demand) is a function of the credit impulse rather than the growth of credit, we can observe positive developments in the global supply-demand imbalance. The output gap provides insight into this relationship: when the global output gap is positive, demand exceeds supply, and vice versa.
Therefore, given the rise in the G3 credit impulse, the implications are stronger demand, which leads to increased capacity utilization, providing momentum for both commodities and investment.
Global Outlook
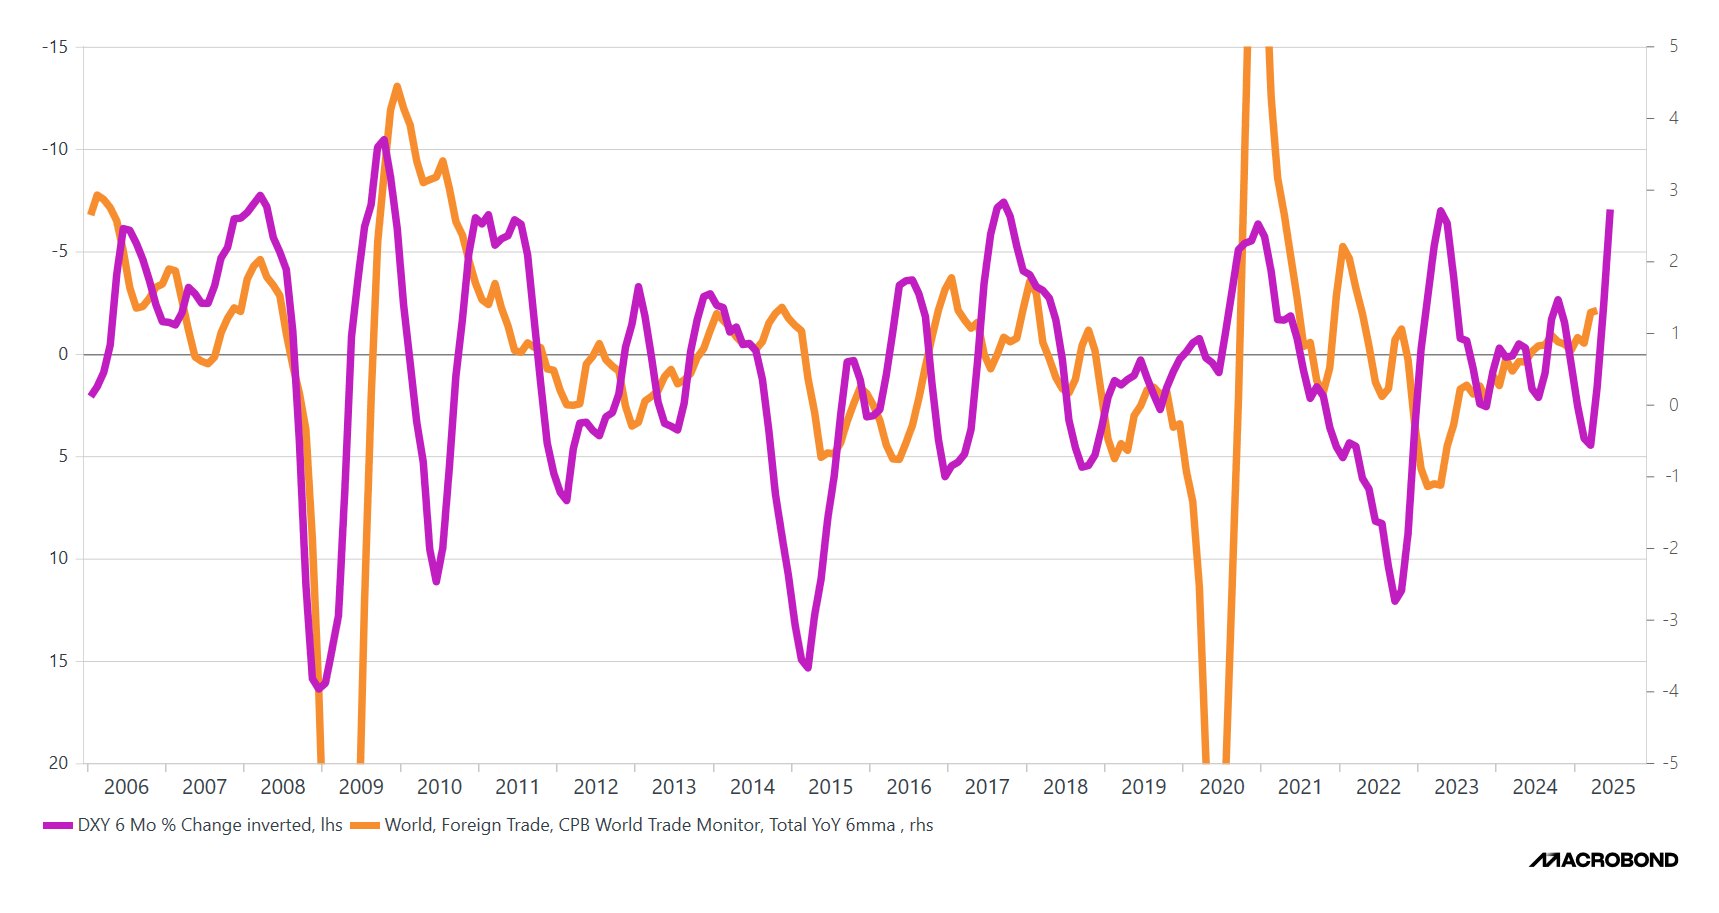
Another reason to be optimistic about the state of global trade—despite concerns around tariffs—stems from the idea of a weak dollar. Historically, global trade flows tend to benefit from dollar weakness.
As global trade slows (largely a function of the business cycle), we often see the dollar being bid up as investors rotate toward safety. However, it's important to note that a weaker dollar boosts domestic production (all else being equal) by making U.S. goods cheaper to foreign buyers, thereby improving export competitiveness.
Increased domestic manufacturing also drives demand for production inputs, many of which are imported. This dynamic allows other nations to continue exporting those goods despite the weaker dollar, supporting global trade flows overall.
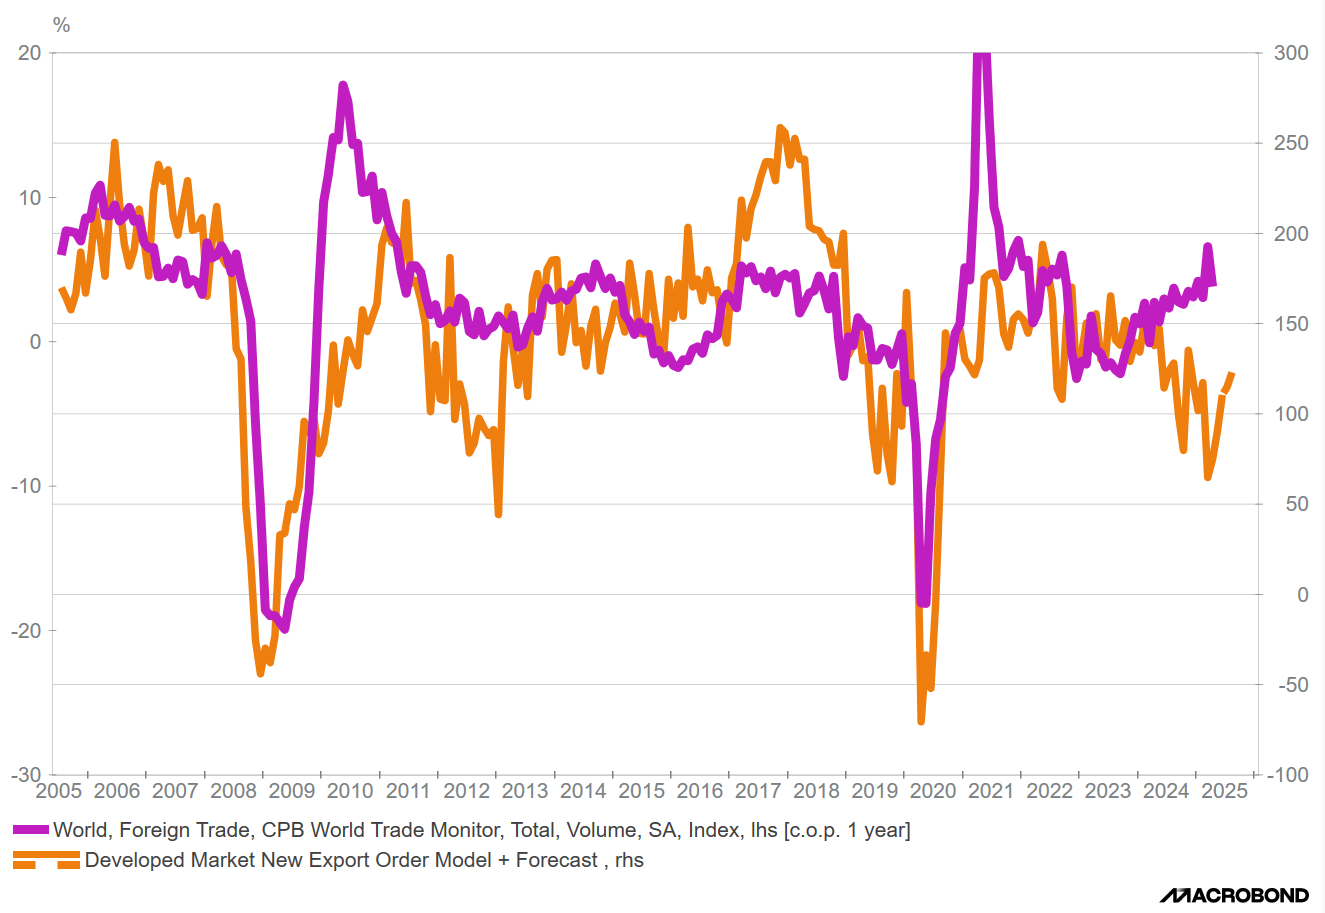
This index tracks new orders across developed markets and serves as a leading indicator for global trade. Intuitively, as more countries experience rising export demand, global trade volumes tend to follow.
We forecast continued strength in new orders through year-end, particularly in the aftermath of tariff front-running. Given the persistent output gap and ongoing supply-demand imbalance, we do not yet see signs of demand easing.
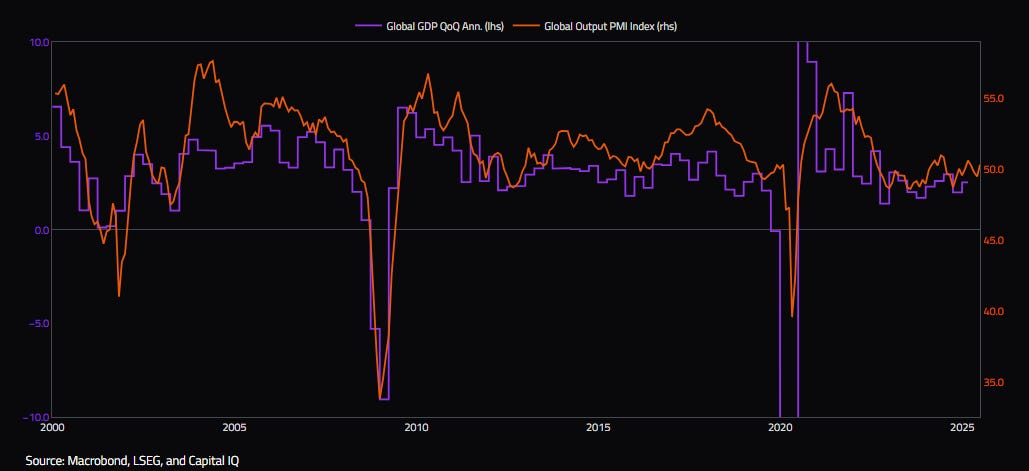
We have recently seen the PMI Output Index come in slightly above 50.00, indicating expansion. At its current level, historical comparisons suggest that global GDP growth would be around 2.5%, which is roughly in line with long-term average growth rates.
However, given the current global output gap, I believe the Output PMI will continue to rise. This should translate into stronger GDP growth, as the continued increase in demand—largely driven by the credit impulse—pushes output higher.
As the flow of credit continues to rise, demand will likely exceed supply, prompting businesses to ramp up production to meet this demand. In the aggregate, however, this dynamic is likely to place upward pressure on the global price level.
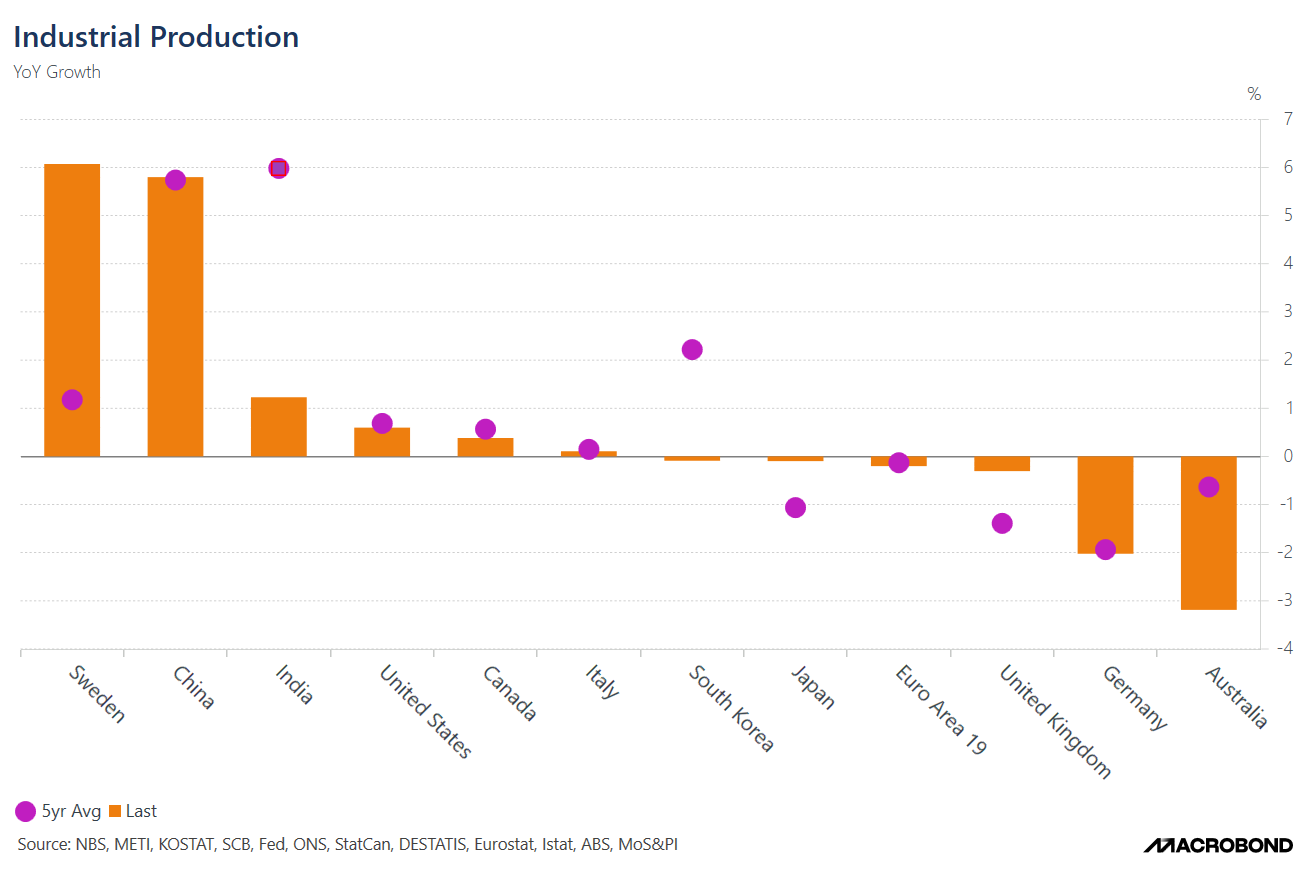
Overall, the global outlook for industrial production remains relatively optimistic when compared to the 5-year average. Most countries are reporting industrial output that is either in line with or slightly above their recent historical norms.
However, there are notable exceptions—India, South Korea, and Australia—which are currently running well below their 5-year averages, signaling localized weaknesses or structural slowdowns in those economies.
On the positive side, Japan has seen a significant revival. Historically, Japan has averaged an industrial production growth rate of approximately -1.06% YoY, but it is currently hovering at -0.09%, indicating a strong rebound. The United Kingdom is also showing encouraging signs of improvement, contributing to the broader picture of stabilization across developed markets.
With the exception of the three lagging nations, the recent YoY growth rates in industrial production suggest that the global economy is not in a decelerating phase. While it’s fair to argue that industrial production data is inherently backward-looking, there are forward-looking indicators that support a constructive view.
Specifically, the reacceleration in global credit flows, combined with a positive global output gap—where demand is outpacing supply—are both strong signals. These dynamics should continue to support an expansion in industrial production and manufacturing, which in turn will help sustain global trade volumes and demand for key commodities.
Geopolitical events, and current supply/demand imbalances should continue to lead to more supply chain pressures. This imbalance should continue to drive further investment as demand > supply, and will most likely push up shipping prices. Historically , as the output gap rises it pushes on global supply chains to try to meet demand. It also means that aggregate price level should rise to try to shift demand to the left.
Conclusion
Global macroeconomic dynamics are shifting amid evolving industrial production trends, rising PMI figures, and an improving global credit impulse. The outlook for global trade remains optimistic, with developed market new orders pointing to continued strength in exports and investment demand. Japan's industrial revival and the rebound in G3 credit impulse underscore a cyclical recovery, supporting commodity demand and capacity utilization through 2026.
The output gap framework provides a useful lens for understanding current disequilibriums between supply and demand. Rising credit impulse, rather than just credit growth, is emerging as the key driver of economic activity, influencing capital expenditures, manufacturing, and trade flows.
As inflation moderates and manufacturing cycles reaccelerate, we expect a synchronized global upturn—particularly as inventory rebuilding, higher industrial production, and positive new order data come into play. This macro backdrop supports a bullish stance on global growth, metals demand, and industrial sectors as the world enters a new phase of the business cycle recovery.
To me your credit impulse chart looks closer to the end of an impulse than signaling an upturn, and it’s still in negative territory. China could see some demand turn up, but a renewed surge in investment seems unlikely. Most stimulus efforts have been consumption focused like the trade in program. US manufacturing is shedding jobs, and is an inventory restocking cycle really in the cards given tariff front running? Maybe when July 9 passes and there is a little more trade certainty out there. If anything this cyclical upswing seems like a 2026 phenomenon when the bulk of the reconciliation bill kicks in and hopefully all the trade related uncertainty is in the rear view.
Thinking out loud here mostly, and thanks for posting, very though provoking stuff.
Re China In the last commodity boom they were building ghost cities which used alot of commodities. If this time they are bailing out real estate companies, the credit will increase but it won't translate into more commodities. In general it must depend on what the credit is being used for IMO. A pile of money to fund venture AI companies which are buying NVDA GPU is not the same as building high rises. Both will move GDP but the multiplier is different, correct?