Introduction
Canada is a nation with vast resources, as well as a highly educated population. However, when we peel back the layers, problems start to arise. Many of those who have followed me for a long time know that I am an American living in Canada, and I want to see Canada succeed. First, there's the decline in the overall standard of living. Next, there's the issue of lower rates of productivity compared to their peers in the OECD. Additionally, it is a country with a highly taxed population. Finally, there's the problem of the constraints that have been put on the nation through regulatory red tape, which has hindered its ability to increase production on the energy front. This blog will look at the case for supply-side economic policies to fix Canada’s current issues.
Solow Growth Model
The first place I will start is with the Solow Growth Model. One of the first things that must be addressed is what the Solow Growth Model is, and understanding the ways in which it can help address the overall standard of living issue. Solow Growth Model looks at the inclusion of productive factors in addition to private capital and labor is able to explain the difference in growth rates of GDP per capita income, which is extremely for the topic that will we be analyzed throughout this paper. In the Solow Growth Model, growth is a function of factor accumulation, and this happens in two ways both are a result of labor and capital. Labor growth is exogenous which means that it goes through increases in the population, as for capital is amassed as a function of a high propensity to save. Solow also states that continuous growth can only be achieved by increases in technological progress, and if labor and or technological progress (total factor productivity) stop growing the economy will cease to grow. Total factor productivity and α is capital share of income, therefore labor share of income is 1- α and output per worker will depend on capital per worker and total factor productivity. Next will be examining further technological progress in the Solow Growth Model.
Now it is important to understand the math within the Model to give us further insight into the overall model itself. We first must denote some terms Yt is output at time t, Kt is capital stock at time t, Lt is labor input at time t, It is investment at time t, A is total factor productivity (TFP), L is the labor force, K0 is the initial stock of capital, δ is the capital depreciation rate, s the investment or savings rate, n the population growth rate, and finally g the labor productivity growth rate these are crucial to the model that we will build off below.
Now production is given by Yt = F(Kt ,Lt), and capital accumulation in period t+1 is determined as Kt+1 = Kt +It −δKt .We can further rearrange this equation and we thus get ∆Kt+1 = It −δKt where ∆Kt+1 ≡ Kt+1 −Kt. This is essential for understanding the accumulation of capital as in each period t > 0, kt results thus from the previous investment as well as the previous depreciation of capital. Now looking at consumption and investment we get It = sYt and thus this implies that Ct = (1−s)Yt. Now when we put the entire model together this implies from above that we can simplify the model as ∆Kt+1 = sF(Kt ,L)−δKt. This now gives us the growth model which we can derive the entire steady state from as shown below.
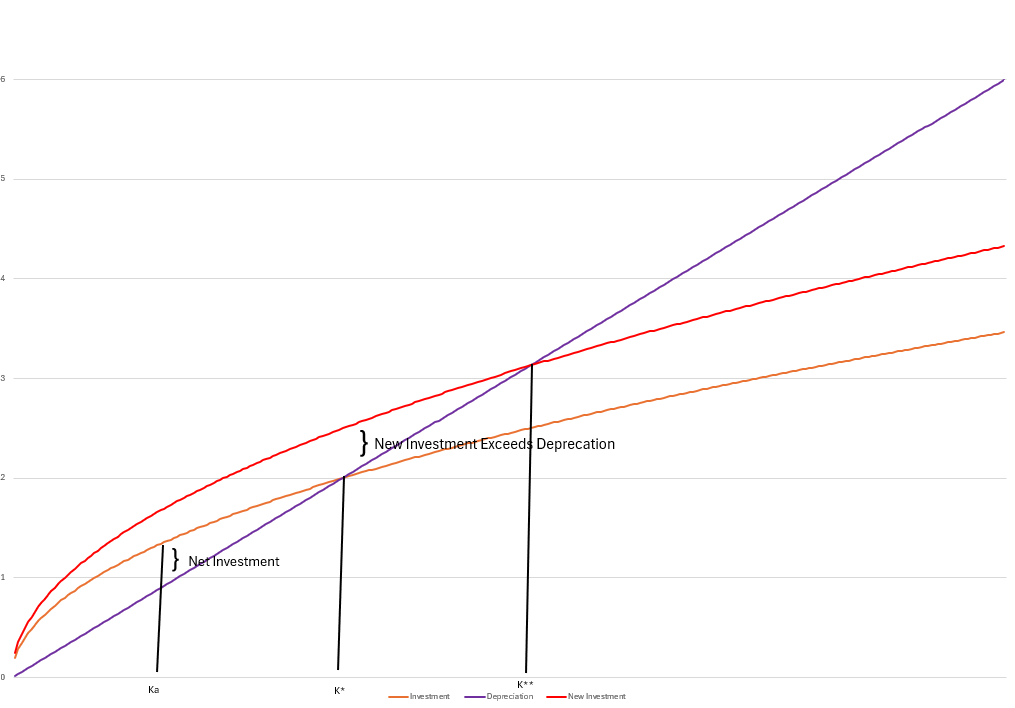
So given the model above we can now find out what different aspects do to economic growth given the model. If we are starting off in an initial steady state as shown below we can see that we hit a put where both sY and δK hit the put of equilibrium this is known as the steady state at this point the economic has hit it’s optimum growth limit this means that on a change in the variables sF(Kt ,L) or δKt can either decrease or increase the long run level of economic growth.
Now as stated above we can see we are at a steady state level within the economy, and this is where the economy will stay unless there are changes to variables within the model. So, we we had a rise in sY to s’Y thus we add more new investment that is greater than the rate of deprecation we get a new steady state and thus a higher level of growth within the economy as shown below. These aspects are crucial to understanding the Canadian problem and the solution to low levels of GDP per capita which will be discussed further in the following sections.
Within the Canadian context, the opposite situation is observed, where one might expect investment to rise. This would lead to a new steady-state with a higher overall output level. However, the issue lies in what is occurring below the surface.
To illustrate this, let's consider the equation 𝑘_𝑡+1=𝑖_𝑡+(1−𝛿)𝑘_𝑡. We can substitute variables to provide clarity. Firstly, we replace 𝑖𝑡it with 𝑖_𝑡=𝑠𝑦𝑡, where 𝑠𝑦 represents the savings rate, and 𝑦𝑡 in the investment equation can be substituted with 𝐴𝑘_𝑡^𝛼 (the production function). This yields the equation 𝑘_𝑡+1=𝑠𝐴𝑘_𝑡^𝛼+(1−𝛿)𝑘_𝑡.
Now what we have in the Canadian context is a decrease in the investment component where In the graph below, Canada's current steady-state is lower than its previous steady-state. We are witnessing a decrease in the steady-state due to the lack of investment, resulting in less capital per capita. Consequently, depreciation exceeds investment. Thus, Canada is experiencing a negative change in capital, denoted as Δ𝑘_𝑡+1<0.
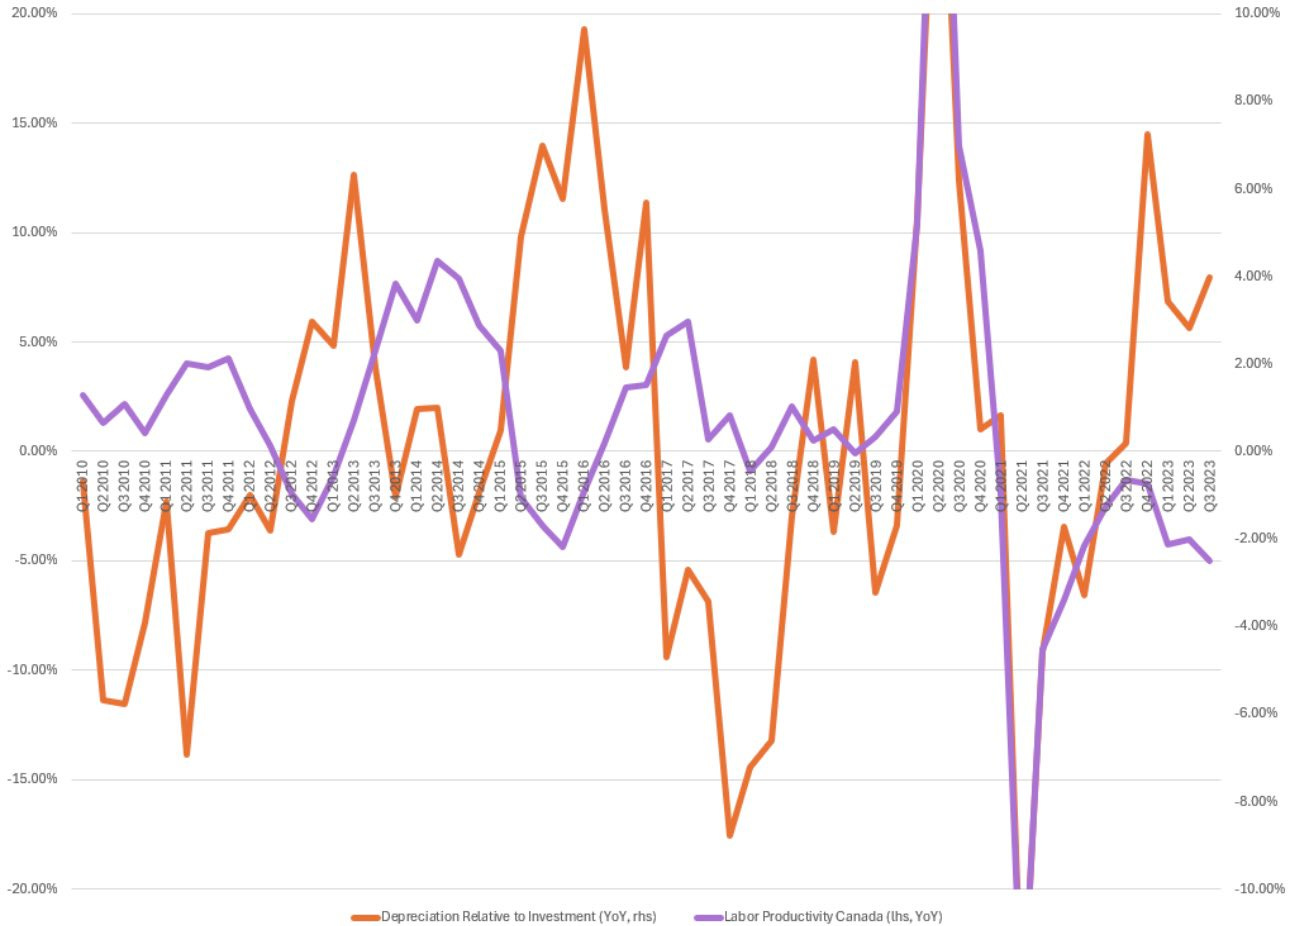
At this point, many of you might be asking, "This is all great and theoretical, but are there real-world examples of this?" The answer to that question is yes. Capital consumption has increased relative to both GDP and the stock of capital in Canada. Consequently, the capital stock has been growing less rapidly than the level of depreciation. This leads to overall lower levels of output in the Canadian economy and, once again, a lower steady state.
What we are witnessing now is that the rate of depreciation of capital is rising faster than the overall level of investment in the capital stock. As mentioned above, this results in Δ𝑘_𝑡+1<0.
The Canadian problem lies in depreciation outpacing the rate of new investment. This means that capital is wearing out faster than it is being replaced, resulting in reduced productivity and output for the Canadian economy. The overall inverse correlation has remained strong, even in the absence of COVID. This is an important metric to monitor for changes in potential output.
Canada and GDP Per Capita
When looking at economic growth measured on a per capita basis, this stagnated during the pandemic, and output has not been able to keep pace with population growth. You had a huge population growth, but that did not keep pace with overall real output for Canada, and real GDP per capita has fell again in Q4 of 2023, and that is continuing the constant decline on a QoQ basis. If Canada wants to increase GDP per capita that can be done by higher labor productivity, higher work intensity, and a higher employment-to-population ratio. Over the last four decades prior to the pandemic nearly all the increases in GDP per capita were a function of the increase in labor productivity. Productivity will remain the key driver of the living standards coming out of the pandemic, and this is where the Solow Residual and the Growth Model play a big role. Below you can see the trend in gross domestic product per capita in Canada from 1981-2023, and right now Canada is well below trend, this is a large contributor to the decline in the aggregate standard of living.
Solow Residual and GDP Per Capita
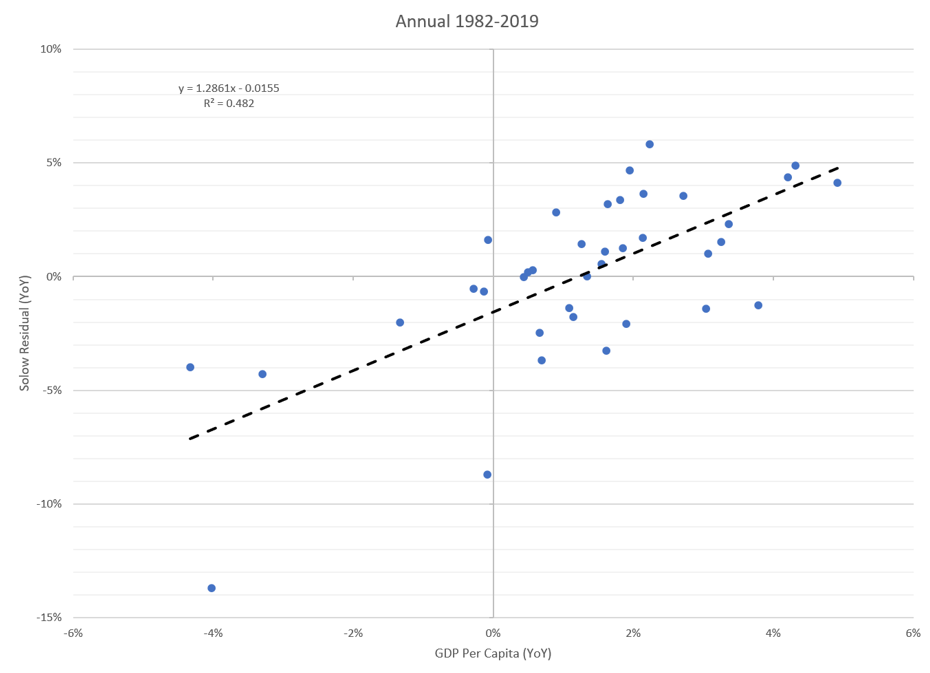
When you start looking at total factor productivity it can explain variations in per capita income across nations. Below I have used data to show how deviations in TFP lead to deviations in GDP per capita and run a regression the R²=.482, so there is a positive correlation between the growth within the Solow Residual and the overall growth in GDP per capita. The assumption with this model is for α=0.4 which is important in analyzing the output given via the regression will change when you change α for the Cobb Douglas production function. In 2005 to 2010 which included the global financial crisis, the Solow residual declined, and this led to a large decline in the overall growth of the economy. So, the overall level of growth (GDP) is largely influenced by the Solow residual, and this effects the overall level of GDP per capita as mathematically GDP Per Capita= GDP/ Population so if the denominator increase and the numerator falls, stays flat, or grows at a level less than the change in population you will have a decline in GDP per capita.
Solow Residual and Investment
The Solow residual, also known as total factor productivity (TFP), is a measure used in economics to account for the portion of output not explained by the amount of inputs used in production. It represents the productivity of all factors of production, such as labor and capital, and reflects the effects of technological progress, efficiency improvements, and other factors that affect the overall productivity of an economy. We can derive this mathematically:
Y=A*F(K,L)
Y is the total output (GDP).
𝐴A is the total factor productivity (TFP), or the Solow residual.
𝐾K is the capital input.
𝐿L is the labor input.
𝐹(𝐾,𝐿)F(K,L) is a function that represents the output generated from capital and labor.
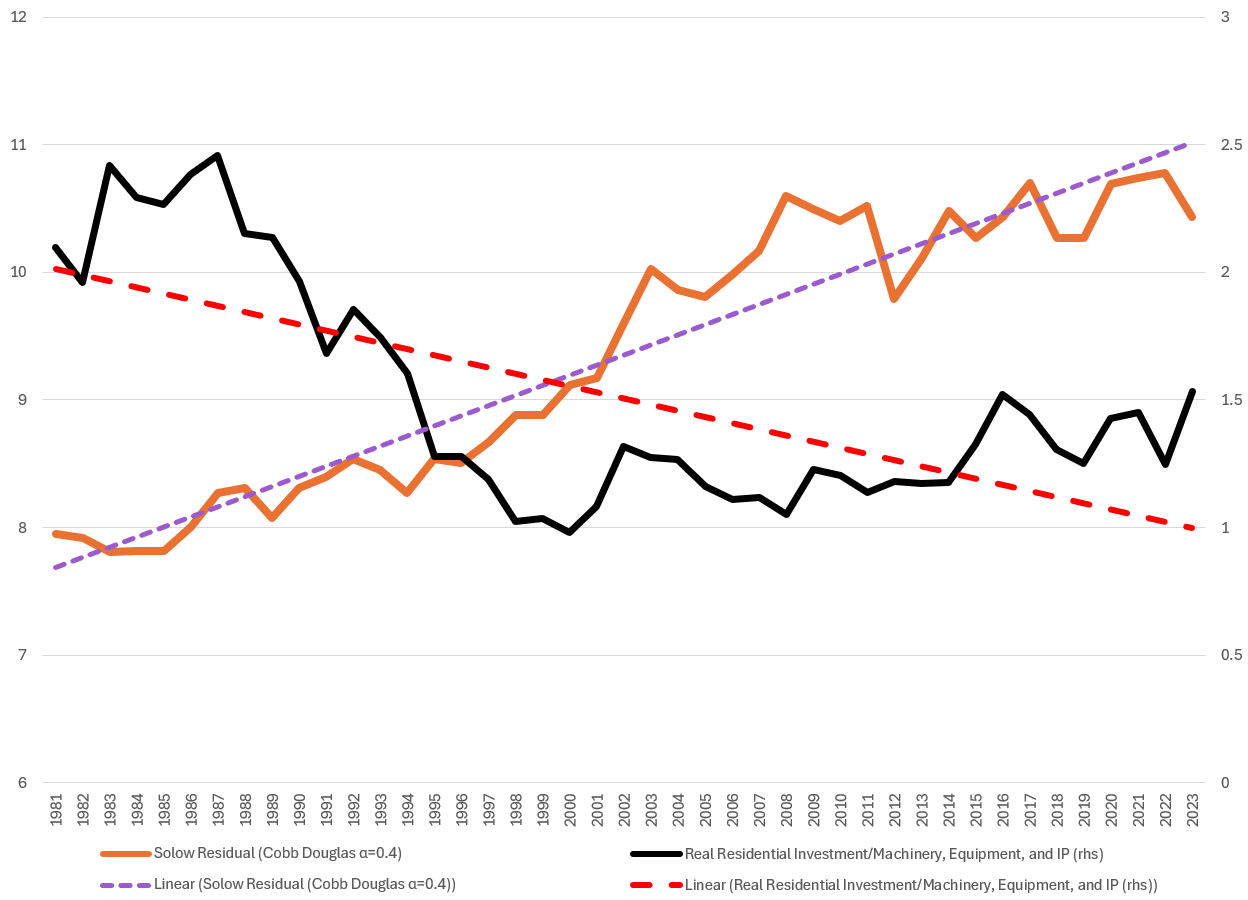
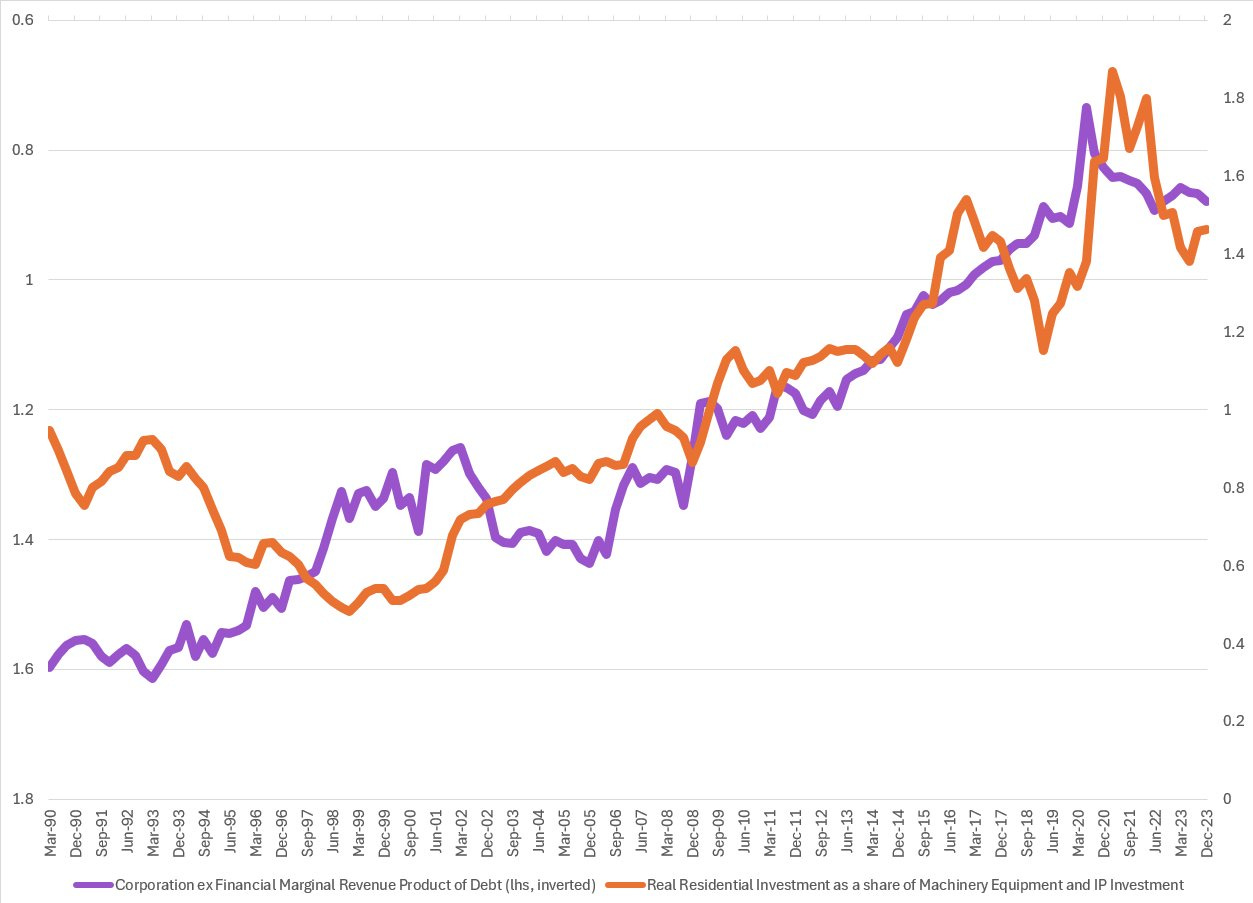
Looking at Canada from the 1980s onward, we see that the ratio of real residential investment relative to investment in machinery, equipment, and intellectual property was extremely high during the 1980s. This meant that more investment was directed towards residential investment than towards capital.
In the context of the Solow Residual, investment in capital often comes with new technologies and more efficient production methods, which can increase total factor productivity (TFP). For example, modern machinery and equipment can improve the productivity of both capital and labor.
As this ratio fell through the 1980s, the Solow Residual rose, reflecting the benefits of increased capital investment. New capital brought new technologies and more efficient methods of production, leading to improved productivity in both labor and capital. However, now this ratio has stagnated, and so has the Solow Residual. Since 2007, the Solow Residual has exhibited a sideways pattern, fluctuating without a clear upward trend and currently growing below the long-term trend. This stagnation coincides with periods in which real residential investment relative to machinery, equipment, and intellectual property has been growing above its long-term trend, leading to a stagnation in TFP.
Capital investment often accompanies technological improvements. A lack of investment can stifle innovation and the adoption of new technologies, which are critical drivers of TFP growth. Without new capital equipment and technologies, productivity improvements are limited, reducing the Solow Residual.
Capital investments frequently fund research and development (R&D) activities. A reduction in capital investment can lead to less spending on R&D, slowing down the pace of technological progress and efficiency gains, thereby lowering TFP growth.
Canada has some of the lowest levels of R&D investment as a percent of GDP, further hindering TFP growth in the country.
Capital Labor Ratio
Focusing on another aspect that has been decreasing the overall level of GDP output and Canada’s declining standard of living is look through the aspect of the capital/labor ratio which is an important function in the Solow Growth Model. When discussing the idea of decline in output per capita was driven by the rise in the population growth, and the inability to increase output, and this will now be explained by utilization of the Solow Growth model. If the population changes by and capital-widening term rises by , so what this means is that the steady-state capital-to-labor ratio (k) falls. This means that the steady-state of output per capita will decrease, and this decreases the overall real wage which decreases the standard of living (Albany University, 2014). As shown below this point is highlighted by the regression where we now see that the R²=0.5586. What we are seeing in the overall ratio which is shown is that overall the level of capital per worker is declining which is harming the overall standard of living by decreasing the real wage.
Incremental Capital Output Ratio Continues to Rise
Canada's current situation underscores a concerning trend: the need to invest a significant portion of its GDP to generate economic growth. This inefficiency is reflected in the Incremental Capital Output Ratio (ICOR), which measures the investment required as a percentage of GDP to produce one percent growth in GDP. A high ICOR indicates inefficiency in generating GDP growth.
Prior to and shortly after the Global Financial Crisis (GFC), Canada experienced stagnation in ICOR, which was initially seen as a positive sign. However, the subsequent rise in ICOR by almost 5x is a serious negative development. This means Canada now has to invest five times more, as a percentage of GDP, to maintain the same economic growth rate as it had in the late 1970s. Similarly, compared to the 2000s, Canada now needs to invest nearly twice as much to sustain the same level of economic growth.
The lack of reduction in ICOR since the 1970s highlights the urgent need for a comprehensive policy overhaul. Additionally, it indicates the necessity of evaluating the overall institutional quality in Canada. Addressing these issues is crucial for fostering sustainable economic growth and improving efficiency in resource allocation.
Impact on Productivity
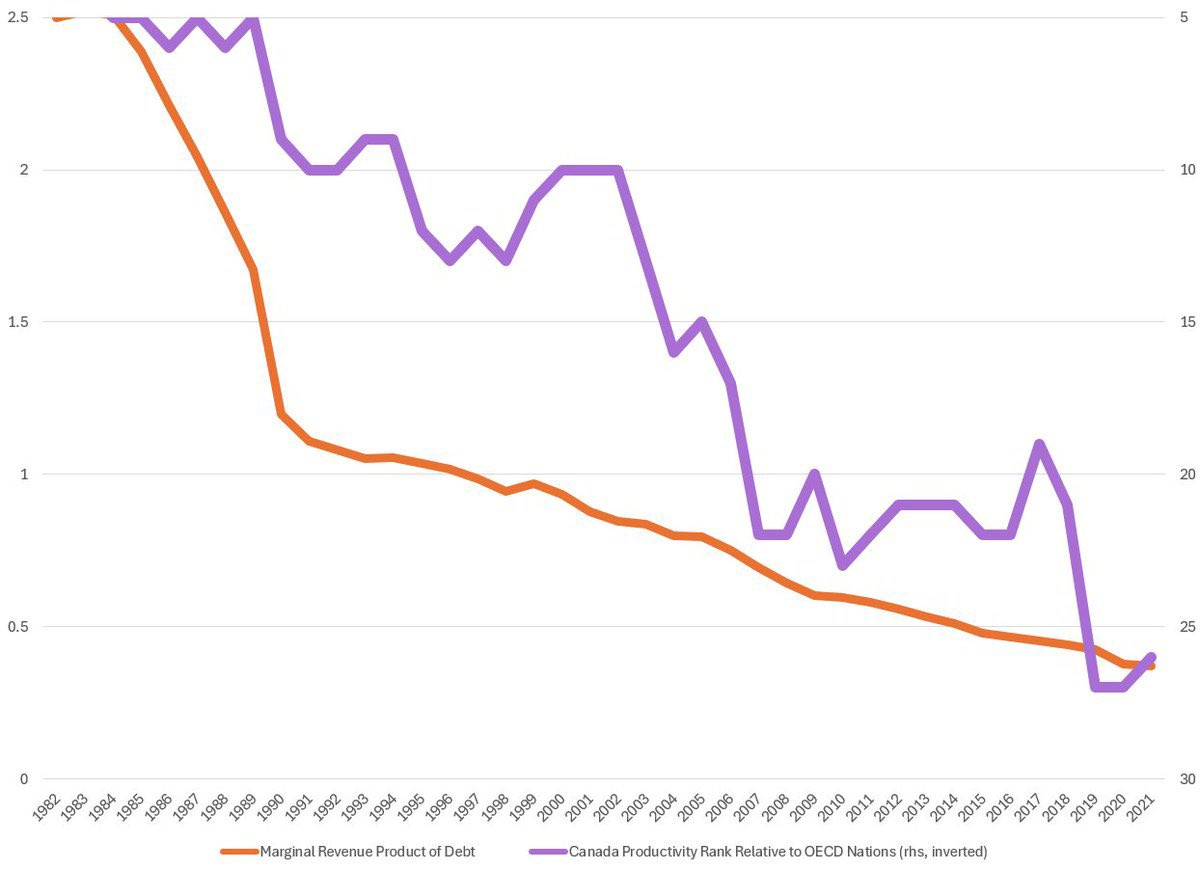
The impact of all the variables mentioned above has led to a rapid decline in Canada's productivity. Canada has experienced a significant decrease in its overall position within the OECD. In the early 1980s, Canada ranked 5th in output per hour among its OECD counterparts. Today, Canada ranks 27th out of 32 countries. Output per hour has deteriorated rapidly, reflecting a prioritization of housing over real economic assets.
This decline in productivity is also reflected in the marginal revenue product of debt. Canada can now only generate 30 cents of GDP for every dollar of growth. It indicates that debt has not been directed towards productive uses. The financialization of the Canadian economy has further exacerbated the decline in productivity.
Canada's preference for residential investment over investment in real economic assets has resulted in a deterioration of GDP per capita, productivity, and capital per worker. This trend has led to a decline in the Marginal Revenue Product of Debt (MRPD) because debt is not being utilized to generate a revenue stream. Instead, money is being drawn from future income to repay debt, resulting in a decrease in the overall marginal revenue product of debt.
Canada's economic woes: Residential investment exceeds investment in real economic assets. Residential investment currently constitutes about 7.75% of GDP, while investment in real economic assets has fallen to nearly 5%. This disparity has significant implications for labor productivity.
Compared to their counterparts in the United States 🇺🇸, Canadian workers have almost half as much capital per worker. The reduction in investment in real economic assets will decrease output due to lower levels of capital intensity.
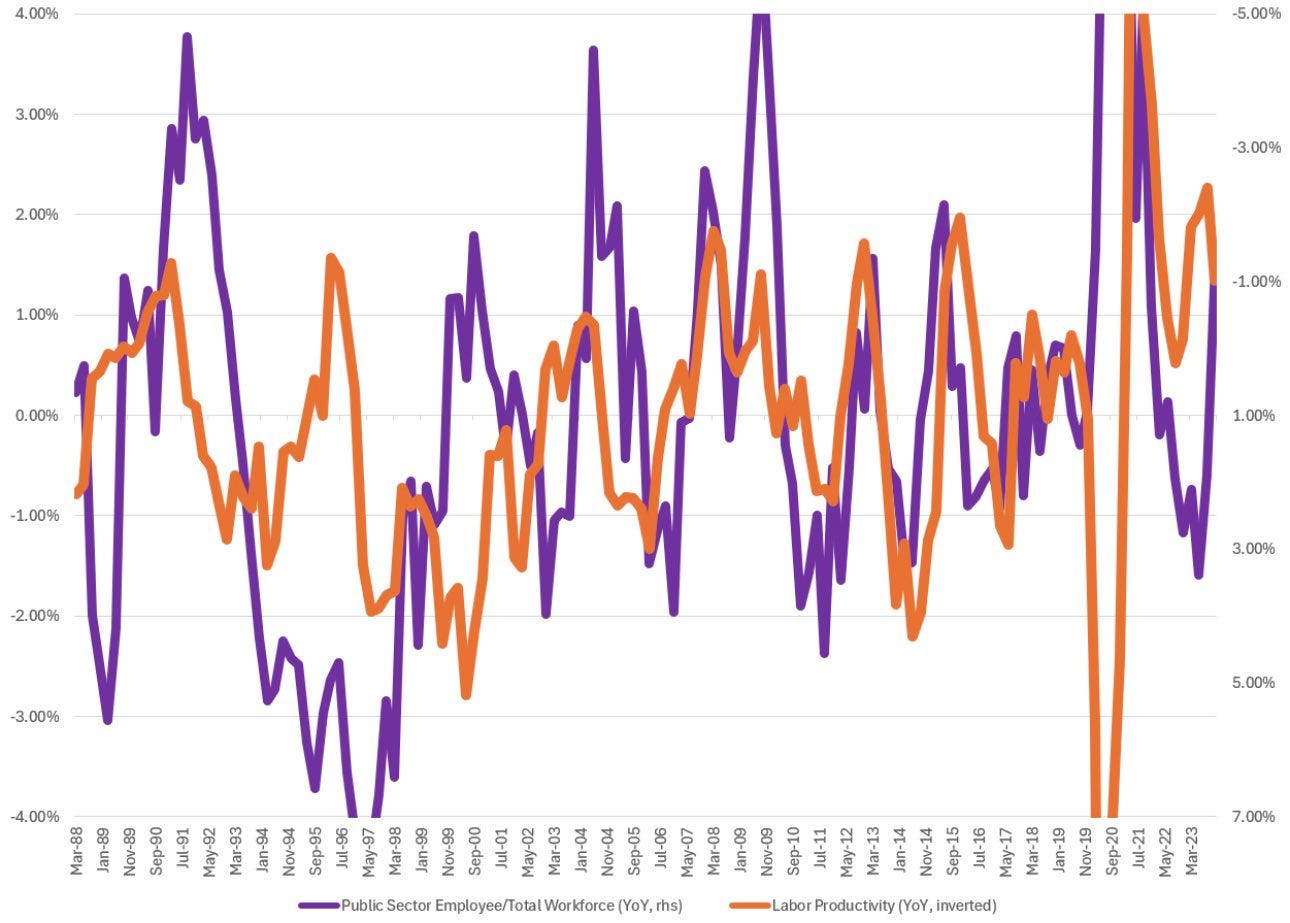
Canada's economy is grappling with the effects of a public sector boom, which is crowding out the private sector and dampening overall productivity.
Since the early 2000s, the share of public sector growth as a percentage of the total workforce has increased by around 3 percentage points. This expansion has coincided with a decline in overall productivity levels. In economics, it's well-established that when the public sector generates demand, it can crowd out private sector activity, particularly when the demand is concentrated in low-productivity services.
The impact on the private sector is exacerbated by the inflexibility of wage determination. In economic theory, wages are typically tied to output or productivity levels. However, in Canada, wages are not necessarily set based on productivity. According to data from the Parliamentary Budget Office (PBO) spanning from 2019 to 2022, total spending on personnel surged by 30%, with an average annual growth rate of about 14.4%, far surpassing the historic 3% growth rate. Compensation per average federal employee also experienced a substantial increase, rising by almost 7% annually, compared to the historical 2% rate, resulting in salaries climbing from $117,000 to approximately $125,000.
This lack of wage rigidity linked to productivity is likely impacting overall productivity in the economy, as evidenced by the negative correlation between productivity and the level of public sector employment, particularly evident pre-COVID. The disconnect between wages and productivity growth is not only raising the natural rate of unemployment but also contributing to crowding out effects and declines in aggregate productivity rates.
(Note: There was a mention of a mistyped graph where the growth rate of the public sector is on the left-hand side.)
More on Productivity
The chart below shows two things: it shows, first and foremost, potential GDP growth relative to real GDP growth. Potential output measures the productive capacity of the Canadian economy. However, it does not act as a ceiling; this can be exceeded by GDP growth, or GDP growth can outpace the growth of potential GDP. When real GDP is above potential GDP, you get what is known as a positive output gap.
Potential GDP helps us understand how close to capacity the economy is running, how efficiently productivity, resources, and capital stock are being utilized. If these were being utilized 100% efficiently, we could say potential and real GDP would be in equilibrium or 1:1. The more underutilization of the variables mentioned above, the wider the gap between potential and real GDP.
Now, this is very important to note: as Canada has moved towards increased investment in residential real estate and away from investment in plants, machinery, and equipment, we can see what happens to potential GDP. As real economic investment is curbed and financialization increases, the gap between potential GDP and real GDP widens.
When real GDP rises more rapidly than potential GDP, it tends to coincide with decreases in residential investment. Historically, the ratio of residential investment to investment in machinery, equipment, and IP has been larger than that of real economic investment. However, when the growth rate of residential investment falls more quickly than that of real economic investment, or falls while economic investment rises, we see increases in real GDP growth over the potential rate.
This is crucial for analyzing what is happening in the Canadian economy. Canada has curbed real economic investment in favor of financialization. Thus, more and more economic resources are being underutilized or diverted from productive investment into malinvestment that does little to raise the standard of living for Canadians.
We can also look at how curbed investment on a year-over-year (YoY) basis affects the overall level of potential GDP relative to real GDP. When examining the chart, there is an inverse relationship between investment and potential GDP growth. When real investment in machinery, equipment, and IP starts to decline, the level of real GDP starts to rise relative to potential GDP. This is because investment is being allocated to less efficient aspects of the economy. Consequently, the economy experiences slower growth (real GDP) compared to its potential. This results in decreased productivity in the Canadian economy and prevents Canada from meeting its potential GDP.
Growth in Canadian Debt
Malinvestment has real consequences for the economy. One way this happens is that as capital is allocated away from productive sectors, it tends to find its way into inefficient uses, such as excessive debt. Debt moves in a parabola mathematically. Initially, taking on debt yields increasing returns at an increasing rate. Then, the utilization of debt grows at a decreasing rate, and finally, debt leads to decreasing returns at an increasing rate.
In the Canadian economy, as mentioned above, we are seeing increasing real residential investment in machinery, equipment, and IP, which tends to correlate with an increase in Canada’s debt-to-GDP ratio. As more debt is utilized, it is often pulled forward to repay existing debt because much of this debt does not generate an adequate income stream to cover its costs. However, during times of deleveraging, when there are increases in investment in machinery, equipment, and IP, it leads to periods of economic stabilization and reduced debt levels.
Another important aspect of this debt growth is examining potential GDP growth relative to the real interest rate in the economy. To keep debt levels sustainable, the overall level of potential GDP growth needs to increase faster than the interest rate. As long as G > R, debt levels within the economy are sustainable. When looking at the overall equation of G - R and real residential investment in machinery, equipment, and IP, we can see that during periods of increased leverage, there are often increases in the overall growth rate relative to the real interest rate. This allows for debt growth and leverage to continue being sustained.
Looking further at this ratio, we can examine macro leverage against the overall G - R equation. The chart below depicts potential GDP growth and real yields in the Canadian economy. It is very rare for real yields to exceed the increase in potential growth. Accumulation can only occur when real yields are low enough. So, looking at the Canadian economy, it seems very likely that rates will fall lower to allow for economic growth to exceed the real yield.
There is a fundamental difference between the United States and Canada, with the largest being that the majority of household debt in the U.S. is on fixed terms. Despite the rapid rise in interest rates, debt service payments as a percentage of disposable income in the U.S. are actually below their historic average. This is not the case for Canada. The inability of Canadian households to lock in their interest payments has led to a rapid rise in debt service ratios.
Currently, interest rates are being priced more aggressively for Canada than for the United States. However, I do not think the spread is wide enough. Given the underlying economic conditions, I expect a much more dovish Bank of Canada relative to the Federal Reserve. This would lead to different economic performances in Canada relative to the United States and most likely a much quicker steepening of the yield curve in Canada compared to that of the United States.
Last Slowing Consumption
Real weekly earnings declined and continued their negative growth rate as labor supply increased. The primary explanatory variable for declines in the real wage is currently the excess supply of labor. This has acted as a constraint on a higher real wage, and thus it flows through into the aggregate slowing of consumption.
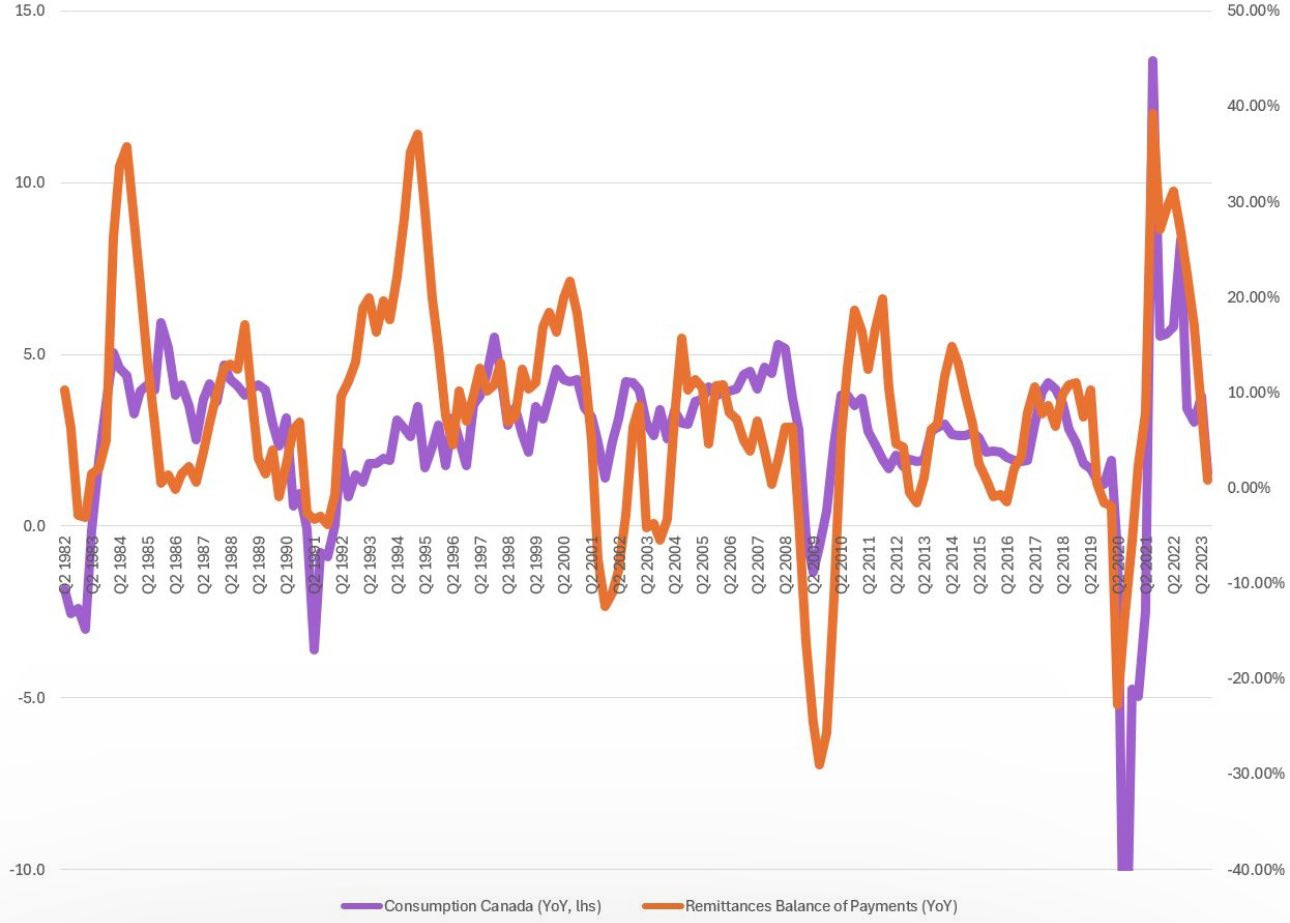
Canada's foreign net remittances show more money leaving the country and declines in consumption.
Remittances are the money that foreign workers send back to their home countries. Looking at the graph, when net remittances grow year-over-year (YoY), indicating more money flowing into Canada or staying in Canada than outflows, it tends to lead to higher levels of domestic consumption. This is because more money is flowing into Canada than leaving, and the money that usually flows back to foreign workers' home countries is retained in Canada.
The strong YoY flows remaining and flowing back into Canada have led to a huge increase in consumption. However, this trend is starting to fade as more and more money is now being remitted back to foreign workers' home countries. This follows the trend of a slowdown in domestic consumption.
If we look at the overall level of outflows at the nominal value during COVID-19, this stabilized, indicating increased flows were not leaving the nation. However, now this trend has reversed, with the nominal value in millions showing increasing outflows.
The growth in outflows is now rising more rapidly than the growth in inflows. As a result, this will put a constraint on consumption as more and more disposable income is remitted back to domestic host countries. This is a trend worth watching going forward.
Taxes Have Consequences
In the 14th century Ibn Khaldun in his Muqaddimah wrote ““It should be known that at the beginning of the dynasty, taxation yields a large revenue from small assessments. At the end of the dynasty, taxation yields a small revenue from large assessments”
Quoting Laffer in his book Taxes have consequences “When top rates have been high, top earners have shoved vast capital resources into tax shelters, depriving the economy not only of tax revenues, but investment and the wellspring of employment and a general prosperity…”
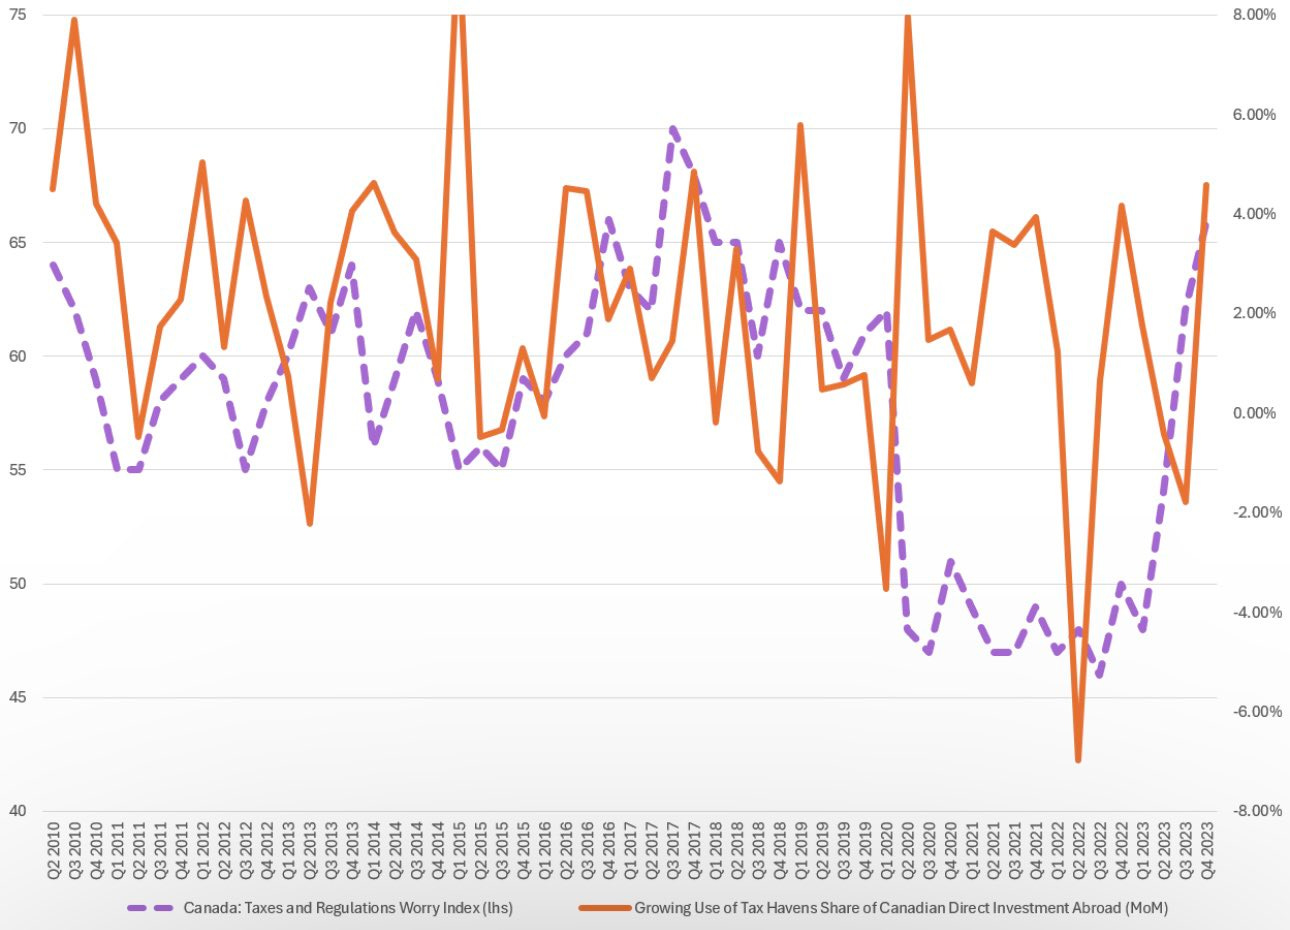
We are seeing this now in Canada. anadian corporations are increasingly diverting their investments to tax havens, signaling a significant flight of capital from the country. This trend has been ongoing for some time, with foreign investment opportunities, particularly in tax havens, becoming increasingly attractive to Canadian businesses.
As a percentage of total investment, investments in tax havens now account for close to 30%. The potential for further increases in this figure looms, especially with the possibility of inclusion rate adjustments, which could accelerate the flight of capital.
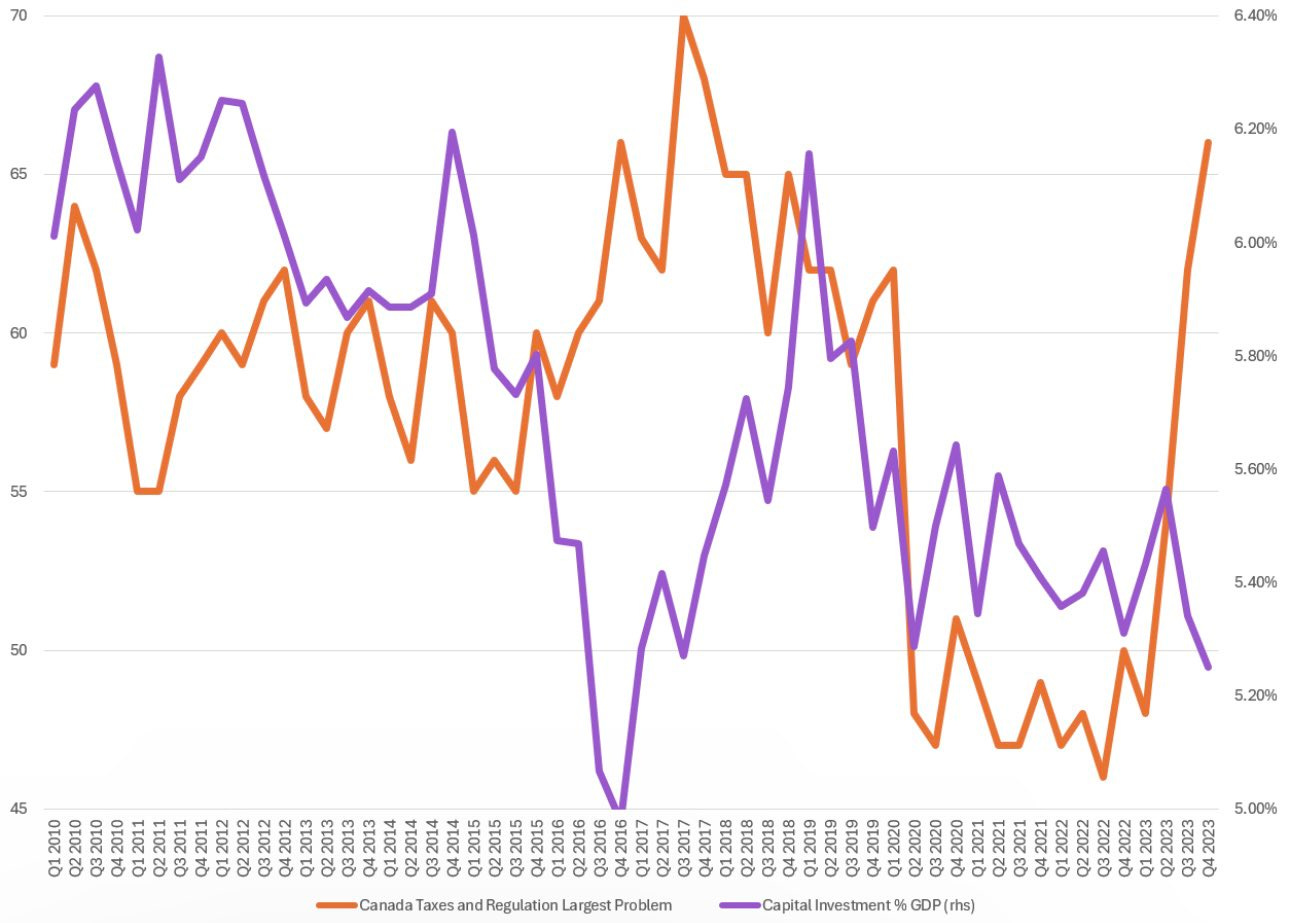
The concept of "locked-in effects" is import it highlighting how corporations refrain from liquidating assets, thereby keeping capital tied to unproductive sectors of the economy instead of reallocating it to areas with higher return on investment (ROI) and greater productivity. The graph below illustrates investment levels against the combined corporate tax rate.
Despite tax cuts implemented over the years, there hasn't been a substantial increase in business investment, and as a percentage of GDP, investment has continued to decline. While tax cuts theoretically should stimulate domestic investment, underlying issues have hindered their effectiveness.
Given that tax cuts haven't significantly boosted Canada's overall investment levels, inclusion rates are unlikely to provide much help and may even exacerbate the decline in business investment as a percentage of GDP. Much of the capital is flowing into other tax havens, where it finds more attractive investment opportunities relative to domestic ones.
This trend suggests that the lack of attractiveness of domestic Canadian opportunities over the past two decades has contributed to the inefficacy of tax cuts. Now, with the inclusion rate potentially exacerbating this trend, the challenge of stimulating domestic investment becomes even more pronounced.
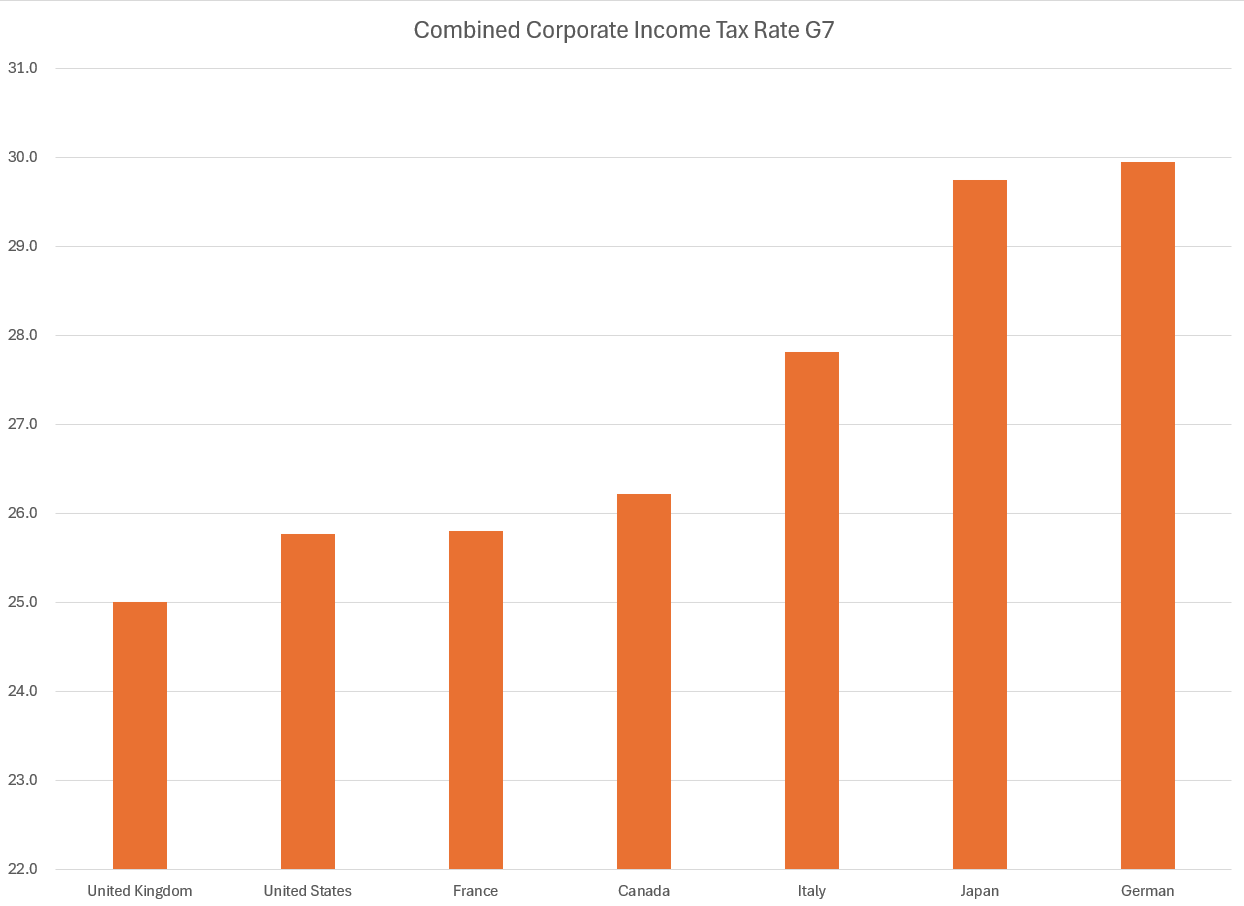
The chart below illustrates the total combined tax rate for corporations in Canada relative to some of its peers in the G7. Despite a decline in the tax rate, it has not been sufficient to drive investment within Canada. Instead, Canadian corporations are finding investments in tax havens and overseas markets increasingly attractive. This trend underscores the challenges Canada faces in stimulating domestic investment and highlights the need to address underlying factors that are driving capital flight and investment diversion.
The top 1% will always find it in their interest to preserve income. High tax rates in Canada have massively curtailed investment. When tax and regulatory worries increase, we see a downturn (COVID being the exception) in capital investment. This brings down the overall level of investment, as more resources are utilized to shelter income and maintain real income. This has trickle-down effects on productivity as well as investment. As the wealthy and top 1% curb investment, and instead focus on ways to shelter taxes this leads to underinvestment in the Canadian economy.
Looking at the utilization of tax havens, we are now seeing this grow rapidly coming out of the pandemic. Worries about taxes and regulations are once again having an impact, with cash being moved abroad. High tax rates on the rich have made economic activity much less attractive, and what is earned is largely sheltered, making investment abroad much more attractive than investment domestically. This not only harms productivity, but it also harms investment. As productivity declines, so do wages.
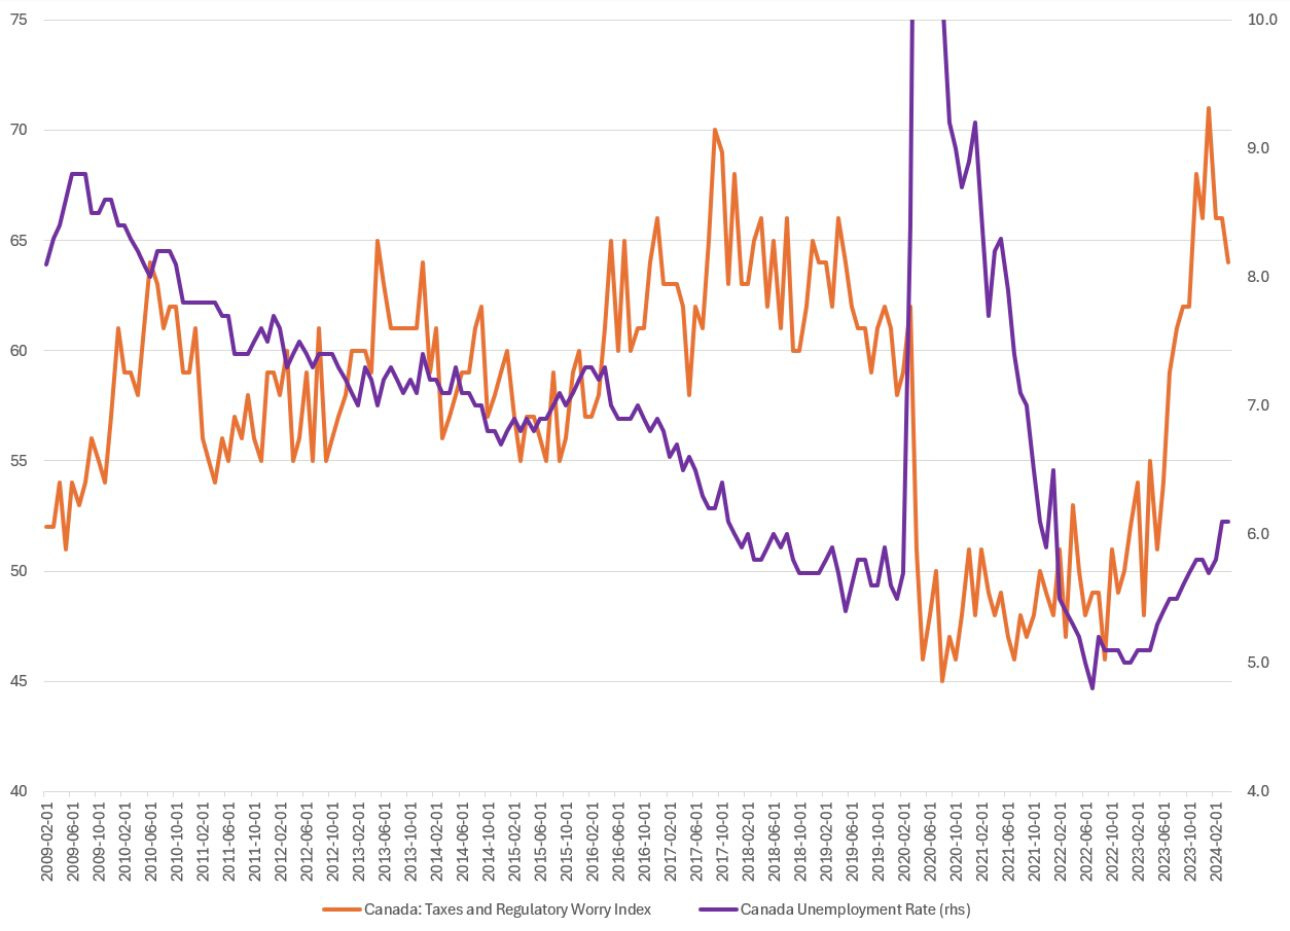
Increases in taxes also tend to lead to an increase in the unemployment rate. Canada’s taxes and unemployment are causing higher unemployment to come. The current tax policies do not seem to be helping the unemployed in Canada. As more capital is shifted to havens and sheltered, employment becomes constrained.
Currently, real incomes in Canada are declining, which tends to lead to decreases in overall tax revenues, especially from the top 1%. As real incomes rise, so do real revenues for the fiscal authority.
This situation also affects the bottom 50% of earners. As real incomes decline, tax revenues decrease. The decline in productivity further compresses workers' incomes.
With increased levels of inflation, the overall level of real income has declined, which in turn has reduced the revenue received by the fiscal authority. This lack of productivity has real effects not just on consumption but also on the revenue the fiscal authority is able to generate.
Conclusion
With all this being said what we are seeing is policies that are constraining growth. This is leading to overall declines in the standard of living for most Canadians. The lack of productivity is constraining GDP growth which is another huge issue for the Canadian economy. If Canada really wants to fuel growth they should cut taxes, and deregulate the incentives that are constraining the economy. As well as regulations that are leading to degradation in institutional quality.


