American Growth and Macro-Outlook
U.S. growth continues to surprise to the upside, yet many remain puzzled by the pace at which America has been able to expand, with no signs of a slowdown ahead. In this post, I will discuss what is keeping the American economy hot and delve into aspects of consumer behavior. This post will highlight the overall macroeconomic outlook for the United States for the remainder of the year.
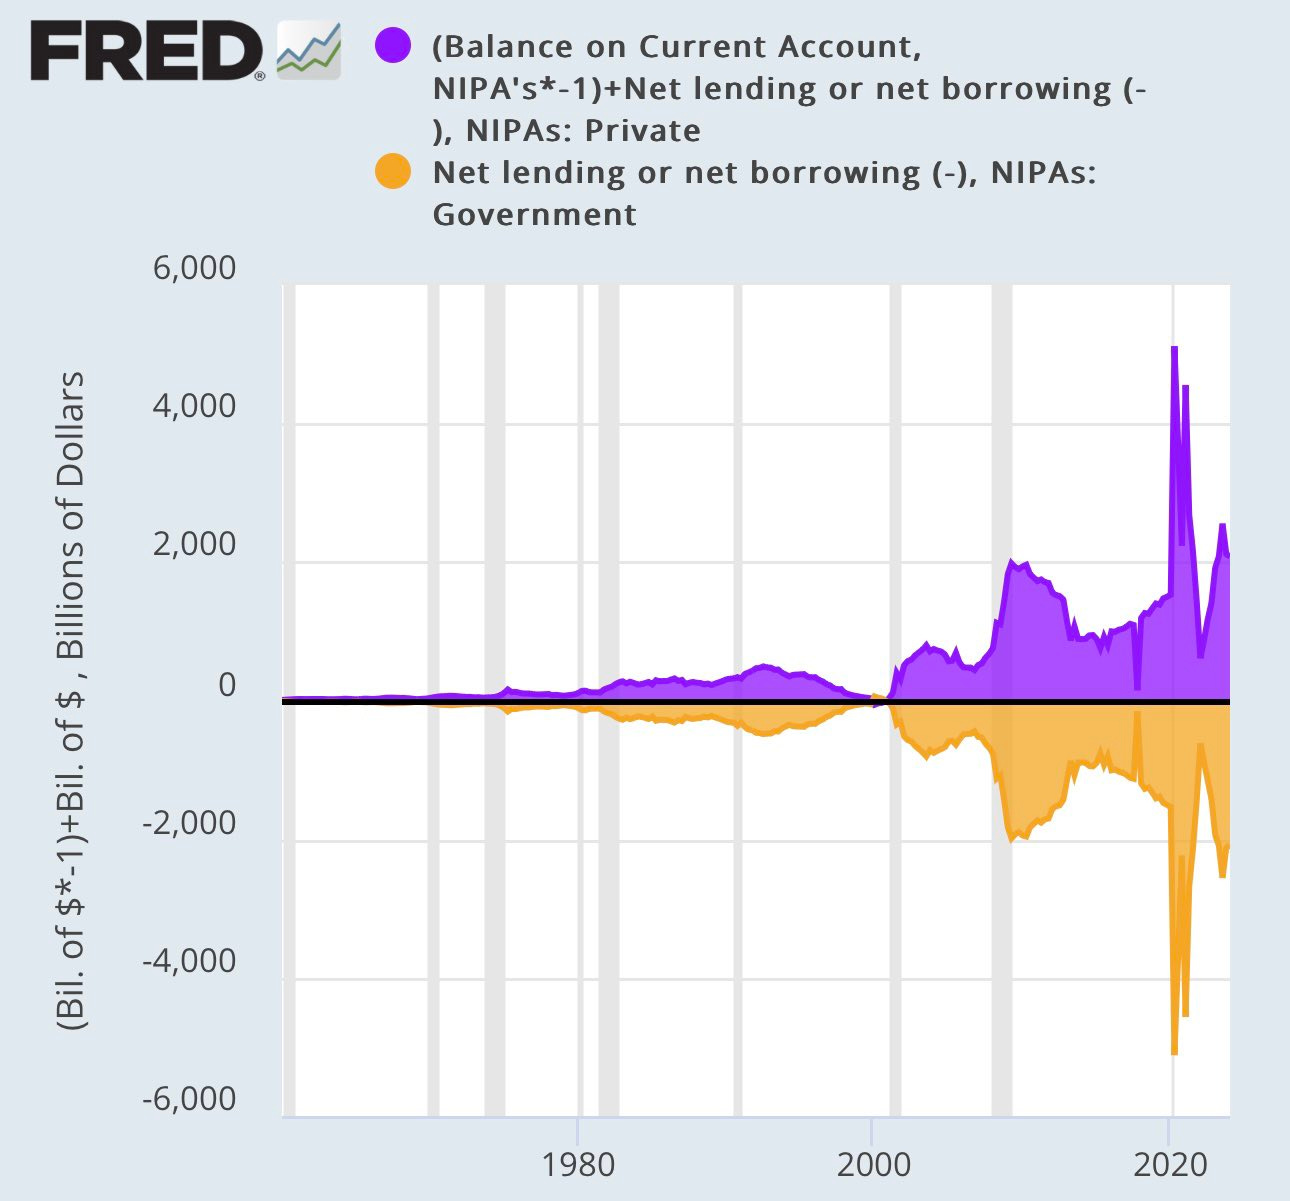
The first place to start is by discussing the deficit—something that many people like to fearmonger about, yet the understanding of how the deficit functions is quite simple. It is simply an accounting identity: you cannot have a credit without the corresponding debit; everything must balance. An easy way to think about this is when the government spends, let's say, $1,000 and takes back $900 in taxes, that results in a government deficit of $100 and a private sector surplus of $100. So the two must always balance. The graph below highlights this. The current deficits run during the COVID pandemic have led to a huge private sector surplus, which means there is a significant cushion for the private sector in terms of its ability to continue consuming.
Now the next topic to tackle is going to be the idea of the mythical R* or the natural rate of interest. One might ask what R* is because it is discussed in Economic media a lot as well as discussed by people at the Fed. R* is the real interest rate that neither stimulates nor slows down the economy when the economy is at full employment and stable inflation. Essentially, R* represents the equilibrium rate of interest that is consistent with stable economic growth and inflation on target.
Mathematically this can be expressed as:
it=R∗+πt+α(πt−π∗)+β(yt−y∗)
it is the nominal interest rate.
R∗ is the natural rate of interest.
πt is the current inflation rate.
π∗ is the target inflation rate (usually around 2%).
yt is the logarithm of real GDP.
y∗ is the logarithm of potential GDP.
α and β are coefficients that represent the central bank's response to inflation and output gaps, respectively.
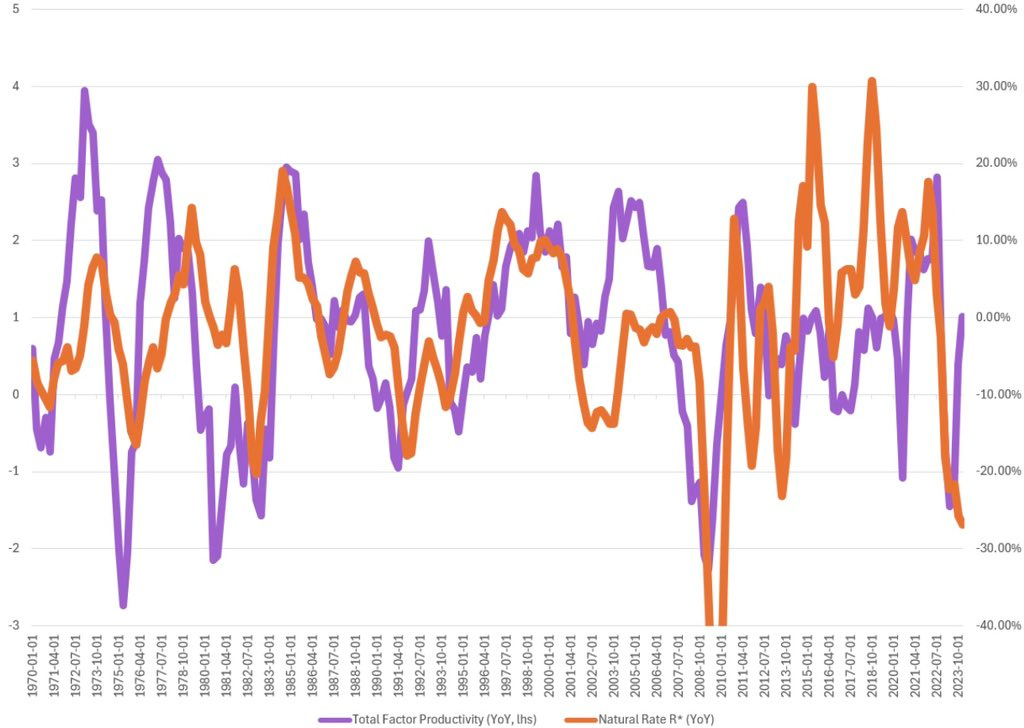
R* in the U.S. is undoubtedly much higher relative to current estimates. The massive revival in Total Factor Productivity (TFP) growth tends to increase the overall natural rate of interest.
Currently, R* growth is lagging behind the significant increase in TFP in the United States.
Now, let's view this through a theoretical economics lens. Increases in total effective productivity tend to lead to increases in investment because firms expect higher future profits. Essentially, productivity equals profits.
As a result, there's an increased demand for funds in the loanable funds market, which pushes up the natural rate of interest. Additionally, higher TFP leads to an increase in the marginal product of capital, making borrowing more attractive and further raising the natural interest rate.
During periods of increased TFP, the aggregate production possibilities frontier theoretically shifts outward. This requires employing more capital and labor, which increases income and savings. The balance between savings and the demand for loans will, in theory, push interest rates higher.
As employees earn more income, there will be an increase in the demand for loans, further driving up the natural rate of interest.
When the economy operates below the natural rate of unemployment, it means it's operating beyond full employment. This typically leads to increased income, which pushes up the natural rate of interest to bring the demand and supply of funds in the loanable funds market into equilibrium.
Thus, the market-clearing interest rate will be significantly higher, helping to cause a leftward shift in demand.
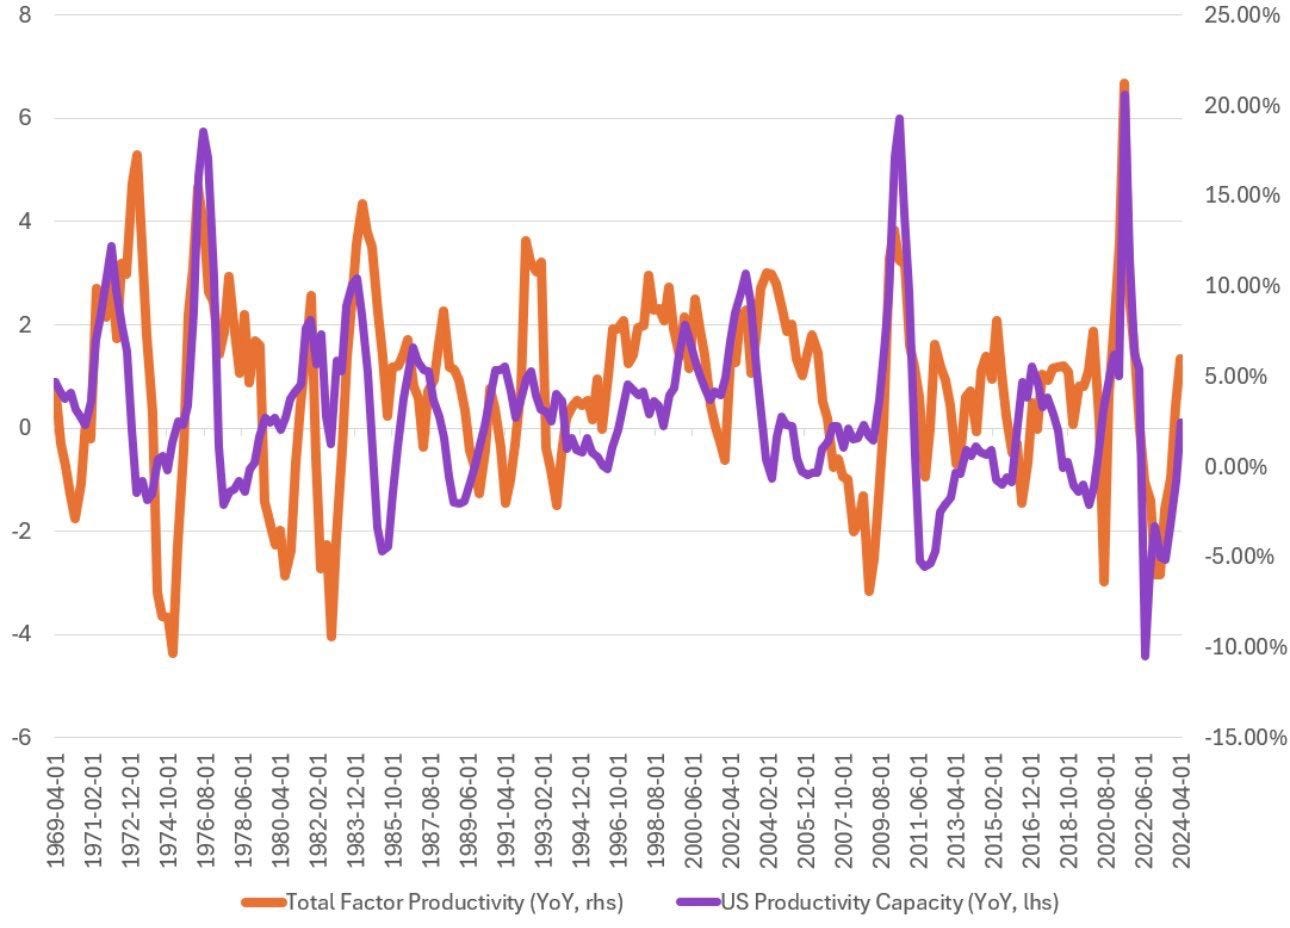
The concept of the output gap is crucial in understanding the Federal Reserve's approach to monetary policy, particularly when considering the likelihood of rate cuts. The output gap measures the difference between actual economic output (GDP) and potential output (the maximum level of output the economy can sustain without generating inflation). A positive output gap occurs when actual output exceeds potential output, indicating that the economy is operating above its sustainable capacity.
A positive output gap signals that the economy is running hotter than its long-term sustainable level. When this happens, resources (such as labor and capital) are being utilized at or beyond their full capacity, leading to upward pressure on prices and wages. Inflation tends to rise as demand outstrips supply, which is a significant concern for the Federal Reserve, whose dual mandate is to maintain price stability and maximize employment.
Historically, the Federal Reserve has been reluctant to cut rates in the presence of a positive output gap. Rate cuts are typically implemented to stimulate economic activity when there is slack in the economy, such as during periods of a negative output gap (when actual output is below potential). With a positive output gap, the economy doesn’t need additional stimulus; rather, it may require tightening to prevent overheating.
Cutting rates in the context of a positive output gap could send the wrong signal to markets. It might suggest that the Fed is less concerned about inflation, which could undermine its credibility in managing inflation expectations. To maintain confidence in its commitment to price stability, the Fed typically avoids rate cuts when the output gap is positive.
In the current environment, with a positive output gap, robust economic growth, and persistent inflationary pressures, the Federal Reserve is more likely to focus on containing inflation rather than providing additional monetary stimulus. This further supports the idea that any expectations of imminent rate cuts are likely to be unfounded or a fade.
A high output gap, where actual economic output exceeds potential output, typically leads to lower levels of unemployment due to increased demand for goods and services. Here’s how this dynamic plays out and why it suggests that the job market, despite some weakening, is unlikely to deteriorate significantly throughout the remainder of the year.
A high output gap indicates that the economy is growing at a pace faster than its long-term sustainable level. To meet the elevated demand for goods and services, businesses ramp up production. This expansion often requires more workers, leading to increased hiring and, consequently, lower unemployment.
As companies operate at or near full capacity, they are more inclined to retain their workforce and may even create additional jobs to keep up with demand. This increased demand for labor keeps unemployment low.
When the output gap is high, the labor market typically becomes tight, meaning there are fewer unemployed workers available relative to the number of job openings. This tightness can exert upward pressure on wages as businesses compete to attract and retain talent.
Given the high output gap, any slowdown in economic activity is unlikely to result in a significant increase in unemployment in the short term. Companies may instead reduce hiring or cut back on overtime before resorting to layoffs.
Even if economic conditions soften slightly, the momentum from previous investments and expansions can sustain employment levels. Companies may continue to hire or at least maintain their current workforce to ensure they can meet demand if conditions improve again.
When the ratio of nominal output growth to labor income growth is positive, it often indicates an increase in productivity. This relationship reflects that the economy is generating more output without a proportionate increase in labor costs. Here’s an explanation of this concept, along with a discussion on the crucial role of Total Factor Productivity (TFP) in enabling increases in nominal output despite weaker labor income growth.
A positive nominal output-to-labor income growth ratio suggests that businesses are producing more without significantly increasing labor costs. This implies that other factors, such as technology, innovation, or more efficient processes, are driving output—hallmarks of increased productivity.
TFP is crucial because it enables the economy to grow even when labor income growth is weaker. If TFP increases, it means that the economy can produce more output with the same or fewer inputs. This is particularly important in environments where wage growth is slow, as it allows nominal output to expand without relying heavily on increases in labor costs.
When the ratio of nominal output growth to labor income growth is positive, it points to productivity gains, indicating that the economy is becoming more efficient. Total Factor Productivity (TFP) plays a crucial role in this dynamic, enabling the economy to increase nominal output even when labor income growth is weaker. By improving the efficiency of all inputs in the production process, TFP ensures that economic growth can be sustained through innovation, technology, and better resource allocation, rather than relying solely on labor cost increases. This makes TFP a key driver of long-term economic growth and prosperity.
The relationship between the effective labor share and the output gap is an important aspect of macroeconomic analysis. Understanding how these two concepts interact can provide insights into the distribution of income between labor and capital, as well as the overall economic health.
The effective labor share tends to be sensitive to the economic cycle, which is closely related to the output gap. When there is a positive output gap (the economy is booming), labor demand increases as businesses expand production to meet higher demand. This can lead to higher wages and benefits, increasing the effective labor share.
When the output gap is positive (the economy is overperforming), the effective labor share may increase as unemployment falls and wage growth rises. In such times, businesses may increase wages, leading to a higher share of income going to labor.
The effective labor share and the output gap are interconnected, with the output gap influencing the cyclical changes in the labor share. A positive output gap tends to increase the labor share as demand for labor rises, while a negative output gap typically suppresses it. However, structural factors can also play a significant role, potentially weakening the relationship between these two variables. Understanding this dynamic is crucial for policymakers aiming to balance economic growth with equitable income distribution.
When analyzing the drivers of consumer spending, many people often assume that credit availability is the most crucial factor. However, the most important variable for consumption is actually nominal labor income growth. Here's why nominal labor income growth is more critical than credit, and how it directly influences nominal consumption.
Nominal labor income growth refers to the total increase in wages, salaries, and other forms of labor compensation, measured in current prices without adjusting for inflation. This income is the primary source of purchasing power for most households.
When nominal labor income grows, households have more disposable income to spend on goods and services. This increase in income is a direct and sustainable source of consumption because it reflects the actual money available to consumers.
As workers receive higher nominal wages, their capacity to spend increases. This additional spending power translates directly into higher nominal consumption, driving overall economic growth.
As seen from recent data, nominal income growth has ticked up slightly in the past month. This uptick suggests that workers are earning more, even if only modestly. As a result, we are now witnessing a corresponding increase in nominal spending.
This direct correlation between rising nominal incomes and increased consumer spending underscores the critical role of labor income in driving consumption. When consumers have more money in their pockets from their earnings, they are more likely to spend, which boosts demand across the economy.
The recent increase in nominal labor income growth implies that consumers should not face significant constraints on their spending in the coming quarters. As long as nominal income continues to grow, consumers will have the financial means to maintain or even increase their consumption levels.
This suggests a positive outlook for consumer spending, which is a crucial component of overall economic activity. With labor income providing a strong foundation, consumption should remain robust, supporting continued economic growth.
While credit can influence consumer spending, the most important variable for sustainable consumption is nominal labor income growth. As income grows, so does the ability of consumers to spend, leading to higher nominal consumption. The recent tick-up in nominal income growth has already translated into increased spending, indicating that the consumer sector is likely to remain resilient over the next few quarters. This steady income-driven consumption provides a solid base for economic stability and growth, reducing the likelihood of consumption constraints in the near future.
Increases in Total Factor Productivity (TFP) can significantly influence Real GDP and its relationship to Potential GDP. Here’s how rising TFP can lead to Real GDP exceeding Potential GDP and what it implies about the economy's performance.
When TFP increases, the productive capacity of the economy rises. This means that with the same level of labor and capital, the economy can produce more goods and services. As a result, Real GDP, which measures the actual output of the economy, can exceed Potential GDP, the level of output the economy can sustain over the long term without generating inflationary pressures.
Increased TFP shifts the Aggregate Supply (AS) curve to the right. This shift represents an expansion in the economy’s productive capacity. When the AS curve shifts rightward, it allows for higher Real GDP at any given price level, pushing Real GDP above Potential GDP.
In the short term, an increase in TFP can lead to Real GDP exceeding Potential GDP. This occurs because the economy’s productive capabilities have improved, allowing it to operate at a higher level of output without immediately facing the typical constraints that would push prices up (such as resource bottlenecks).
When TFP growth is strong, it indicates that the economy is operating at a "hot clip," meaning it is experiencing robust growth with no immediate signs of a slowdown. The higher efficiency and productivity enable continued expansion and higher output levels.
When Real GDP is above Potential GDP due to increased TFP, it suggests that the economy is growing rapidly without the usual constraints. This can point to a period of strong economic performance and optimism, with businesses and consumers benefiting from improved productivity.
Increases in Total Factor Productivity (TFP) enhance the productive capacity of the economy, allowing Real GDP to rise above Potential GDP. This reflects a period of robust economic performance with high output levels and efficiency gains. When TFP growth is strong, it suggests the economy is operating at a high pace with no immediate signs of a slowdown. However, sustained monitoring is necessary to ensure that the economy can maintain this growth without leading to inflationary pressures or other imbalances.
Increased Total Factor Productivity (TFP) plays a crucial role in enhancing economic performance by improving the efficiency with which inputs are used to produce output. Here’s a detailed discussion on how increased TFP boosts output per hour and contributes to maintaining a strong economy.
An increase in TFP means that businesses can produce more output per hour of labor and unit of capital. This is because improvements in productivity enhance the effectiveness of each input used in the production process.
Innovations in technology, better management practices, and enhanced processes contribute to higher TFP. For example, automation and advanced machinery can increase the amount of goods produced per hour worked, thus raising output per hour.
Higher TFP leads to greater output without requiring a proportional increase in labor or capital. This productivity boost drives economic growth as businesses can expand production and sales more efficiently.
Increased TFP often encourages further investment in capital and technology, as firms seek to capitalize on productivity gains. This cycle of investment and productivity improvement supports long-term economic stability and growth.
Economies with higher TFP are better equipped to withstand economic shocks. Enhanced productivity provides a buffer against downturns, as businesses can maintain output and profitability even when faced with adverse conditions.
By improving output per hour, higher TFP directly contributes to stronger economic performance. This means that the economy can grow more robustly without needing a proportional increase in input usage.
Increased Total Factor Productivity significantly enhances output per hour by improving the efficiency of input utilization. This boost in productivity leads to sustained economic growth, higher competitiveness, and greater resilience. By driving more efficient production processes and supporting higher wages and investment, TFP helps maintain a strong and dynamic economy.
Looking at the future pricing power of U.S. corporations, I believe it remains robust and will continue to be supported by higher nominal labor income growth. This growth allows companies to pass on costs through increased pricing power.
We need to examine the relationship between the Marginal Efficiency of Capital (MEC) and the Consumer Price Index (CPI). When firms approach the lower bound of the MEC, they will adjust inflation just enough to cover the cost of the real rate. However, if the return on investment falls below the cost of the real rate, firms will raise prices in aggregate.
Over time, given the rise in the MEC, companies have built a significant buffer to cover inflation and maintain a substantial cushion for profits. This should support robust earnings for U.S. companies.
During periods when elasticity becomes increasingly inelastic, companies can raise prices more effectively. This is because the reduction in demand relative to the price increase is lower, indicating greater inelasticity of demand from consumers.
During the pandemic, significant fiscal and monetary support led to a rapid increase in prices. Stimulus measures prevented consumers from feeling significant pressure on their finances, allowing for further price increases as demand became slightly more inelastic.
Given that pricing power is easing but demand remains inelastic due to growth in labor income, we should see relatively resilient consumption in real terms. This environment allows companies to maintain profits without needing drastic price cuts, thanks to the current inelasticity.
While this observation holds in aggregate, some earnings calls have noted slowing consumer demand. Nevertheless, in aggregate terms, the elasticity of demand continues to be inelastic.
There isn't much predictive power in the equity risk premium.
For example, the low and negative equity risk premiums in the early 1990s were followed by decent S&P returns. Similarly, the high equity risk premiums in the mid-2000s were accompanied by periods of negative S&P forward returns.
Currently, with the equity risk premium approaching negative territory, forward S&P returns have been elevated.
Relying on the equity risk premium does not significantly enhance one's ability to predict market performance for several reasons.
The equity risk premium, which measures the excess return of stocks over risk-free assets, exhibits significant variability over time. Historical instances show that both high and low equity risk premiums have been followed by a range of S&P returns, suggesting that the relationship is not consistent or reliable.
Market conditions and investor sentiment can greatly influence stock returns independently of the equity risk premium. Factors such as monetary policy, economic growth, corporate earnings, and geopolitical events often play a more substantial role in determining market performance.
The equity risk premium might not account for structural changes in the market or economy. For example, shifts in economic policy, changes in the risk-free rate, or alterations in investor behavior can all impact stock returns in ways that are not reflected in the equity risk premium.
Overall, while the equity risk premium provides valuable information about the relative attractiveness of equities versus risk-free assets, it does not reliably predict future S&P returns due to its variability and the influence of other market factors.
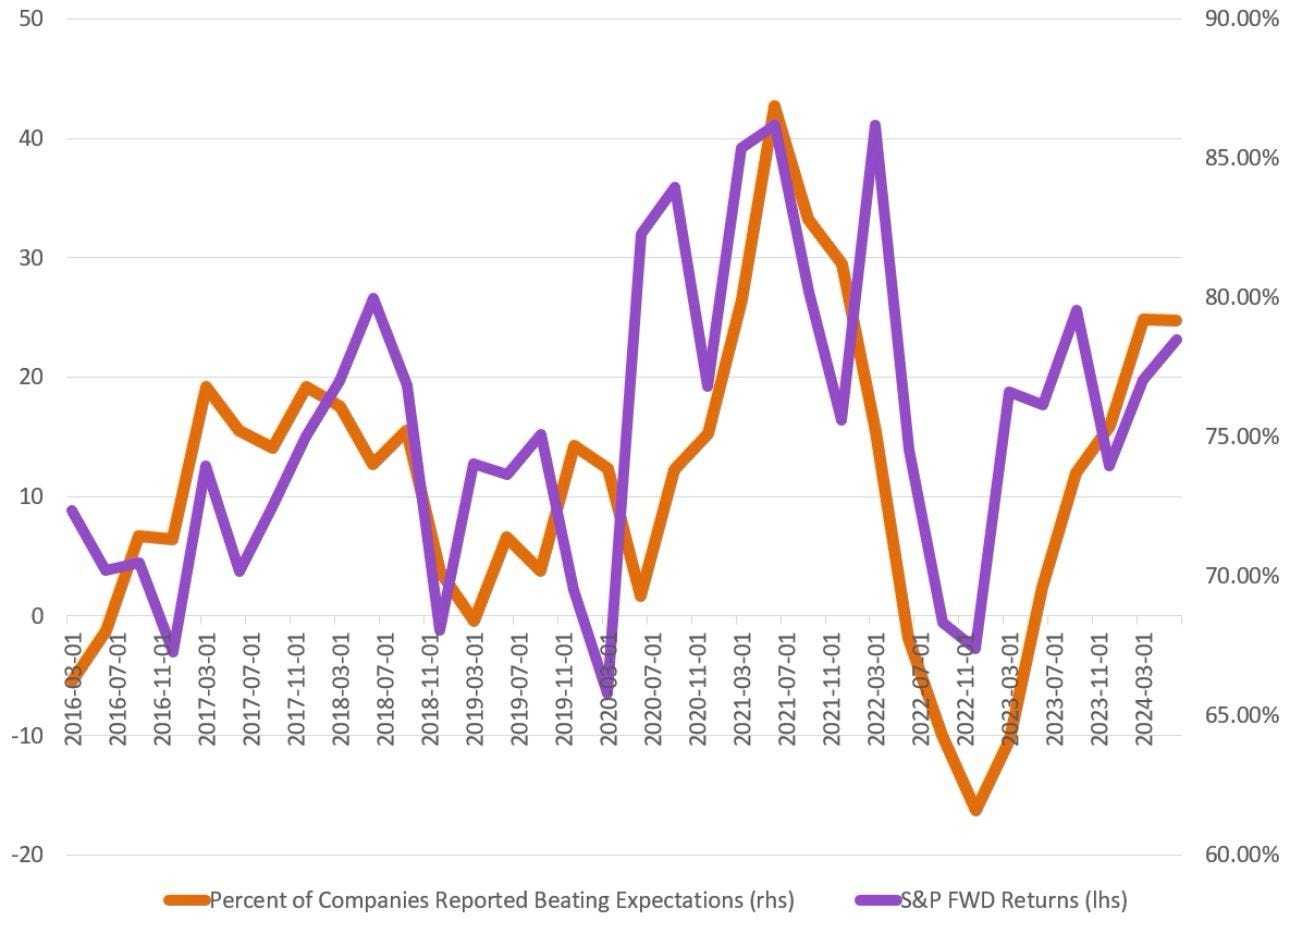
Approximately 80% of the companies that have reported earnings thus far have surpassed expectations for the S&P 500. Given this trend, the strength demonstrated in these results is likely to continue supporting robust forward returns. Continued earnings beats are expected to contribute to upward momentum in the market, as sustained optimism drives increased flows into U.S. equities. As sentiment shifts positively and earnings remain strong, this dynamic is anticipated to further enhance overall investment flows into the U.S. equity markets.
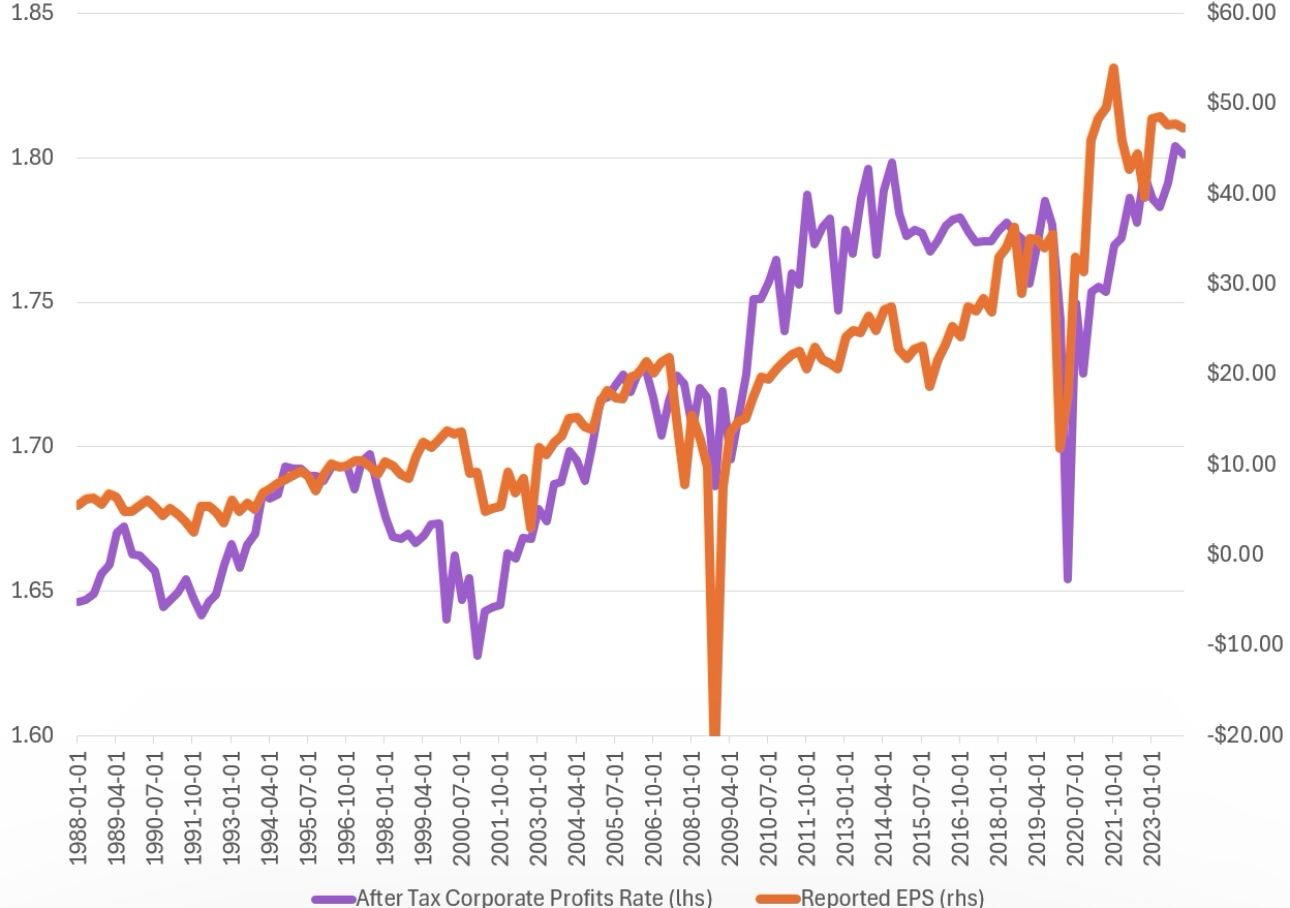
Corporations prioritize generating profits that exceed the rate of real inflation. In the U.S., we have observed robust earnings per share (EPS) growth, reflecting an expansion in the cushion of corporate profits above the real cost of capital.
This situation creates a form of pricing power elasticity for companies. As the buffer of profits significantly surpasses the cost of capital, firms have greater flexibility to adjust prices. At times, this flexibility allows them to lower prices to gain market share while still increasing overall profitability, which enhances earnings.
Currently, however, we are witnessing further price increases, which aim to expand this cushion relative to the real cost of capital. Firms, driven by the objective of profit maximization, are adjusting prices in response to rising costs, which in turn impacts EPS.
Given these dynamics, there is no significant risk of reduced earnings for companies within the S&P 500. The current pricing strategies and profit cushions suggest continued strength in EPS and minimal concern for downward pressure on earnings.
Currently, the dividend yield on the S&P 500 is slightly below that of the 10-year Treasury yield. Despite this, the S&P 500 has continued to outperform, with forward yields approximately 60 basis points higher than the 10-year Treasury. This performance suggests that the S&P 500 is well-positioned to maintain its outperformance, particularly in light of future expectations of lower 10-year yields.
As companies within the S&P 500 experience improved earnings and increased cash flow, there are several key implications for dividend yields and overall attractiveness to investors.
Earnings and cash flow provide companies with greater financial flexibility. This improvement enables firms to return more capital to shareholders through dividends. As companies generate higher profits and maintain robust cash flow, they are often in a position to increase their dividend payouts.
When companies increase their dividends, the dividend yield typically rises. The dividend yield is calculated as the annual dividend payment divided by the stock price. As earnings and cash flow improve, companies may raise their dividends, which, in turn, raises the dividend yield if stock prices do not increase proportionally.
For investors seeking yield, a higher dividend yield can make the S&P 500 more attractive compared to other investment options. As the S&P 500's dividend yield rises, it becomes a more appealing choice relative to the lower yields offered by traditional fixed-income securities, such as Treasury bonds.
Given the expectation of lower 10-year Treasury yields (on deflation pricing) in the future, the S&P 500's higher forward yield becomes increasingly compelling. Investors seeking income may be drawn to equities with attractive dividend yields, further supporting demand for S&P 500 stocks.
The combination of higher dividends and improved earnings is likely to support continued outperformance of the S&P 500. As the dividend yield becomes more competitive, coupled with strong corporate performance, the index's appeal to yield-seeking investors will likely strengthen, reinforcing its market performance.
In conclusion, U.S. growth remains robust, not only from an economic standpoint but also in terms of overall resilience. Despite prevalent fears of a growth recession, it is clear that, in hindsight, the Federal Reserve may have benefited from more aggressive rate hikes. The ability of households to extend their interest rates and the overall revival in economic growth are expected to continue providing significant boosts to U.S. economic activity.
The U.S. equity markets are likely to maintain their growth trajectory from an earnings perspective, supported by a resilient consumer and ongoing investment flows. Given the outperformance of U.S. equities, the investment thesis for the year emphasizes optimism over fear. Embracing a more positive outlook is likely to be key for investors.


